TABLE OF CONTENTS
The Multi-Item View allows users to access and analyze the created forecast results for multiple products simultaneously. This view is similar to the Multi-Item Planning View and provides a structured table displaying all available products and their forecasted values.
Displays all selected products with forecasted values.
Enables users to compare forecasted values across multiple items.
Users can apply filters and sort the data to focus on specific attributes.
Download the forecast results for further offline analysis.

Click the stack button to see the results in the multi-item view. The following will appear.
The results in the table will appear in the collapsed mode by default.
Multi-item forecast view features
Different views of the table
The View By feature allows users to customize how forecast results are displayed in the table. The results of the created Forecast can be analyzed in three different views:
Item View – Displays data based on the selected hierarchical level, allowing analysis at different aggregation levels.
Measure View – This shows measures as headers, with product values listed underneath, providing a structured view of key metrics.
Dimension View – Displays results based on products and measures, helping analyze data across multiple dimensions.
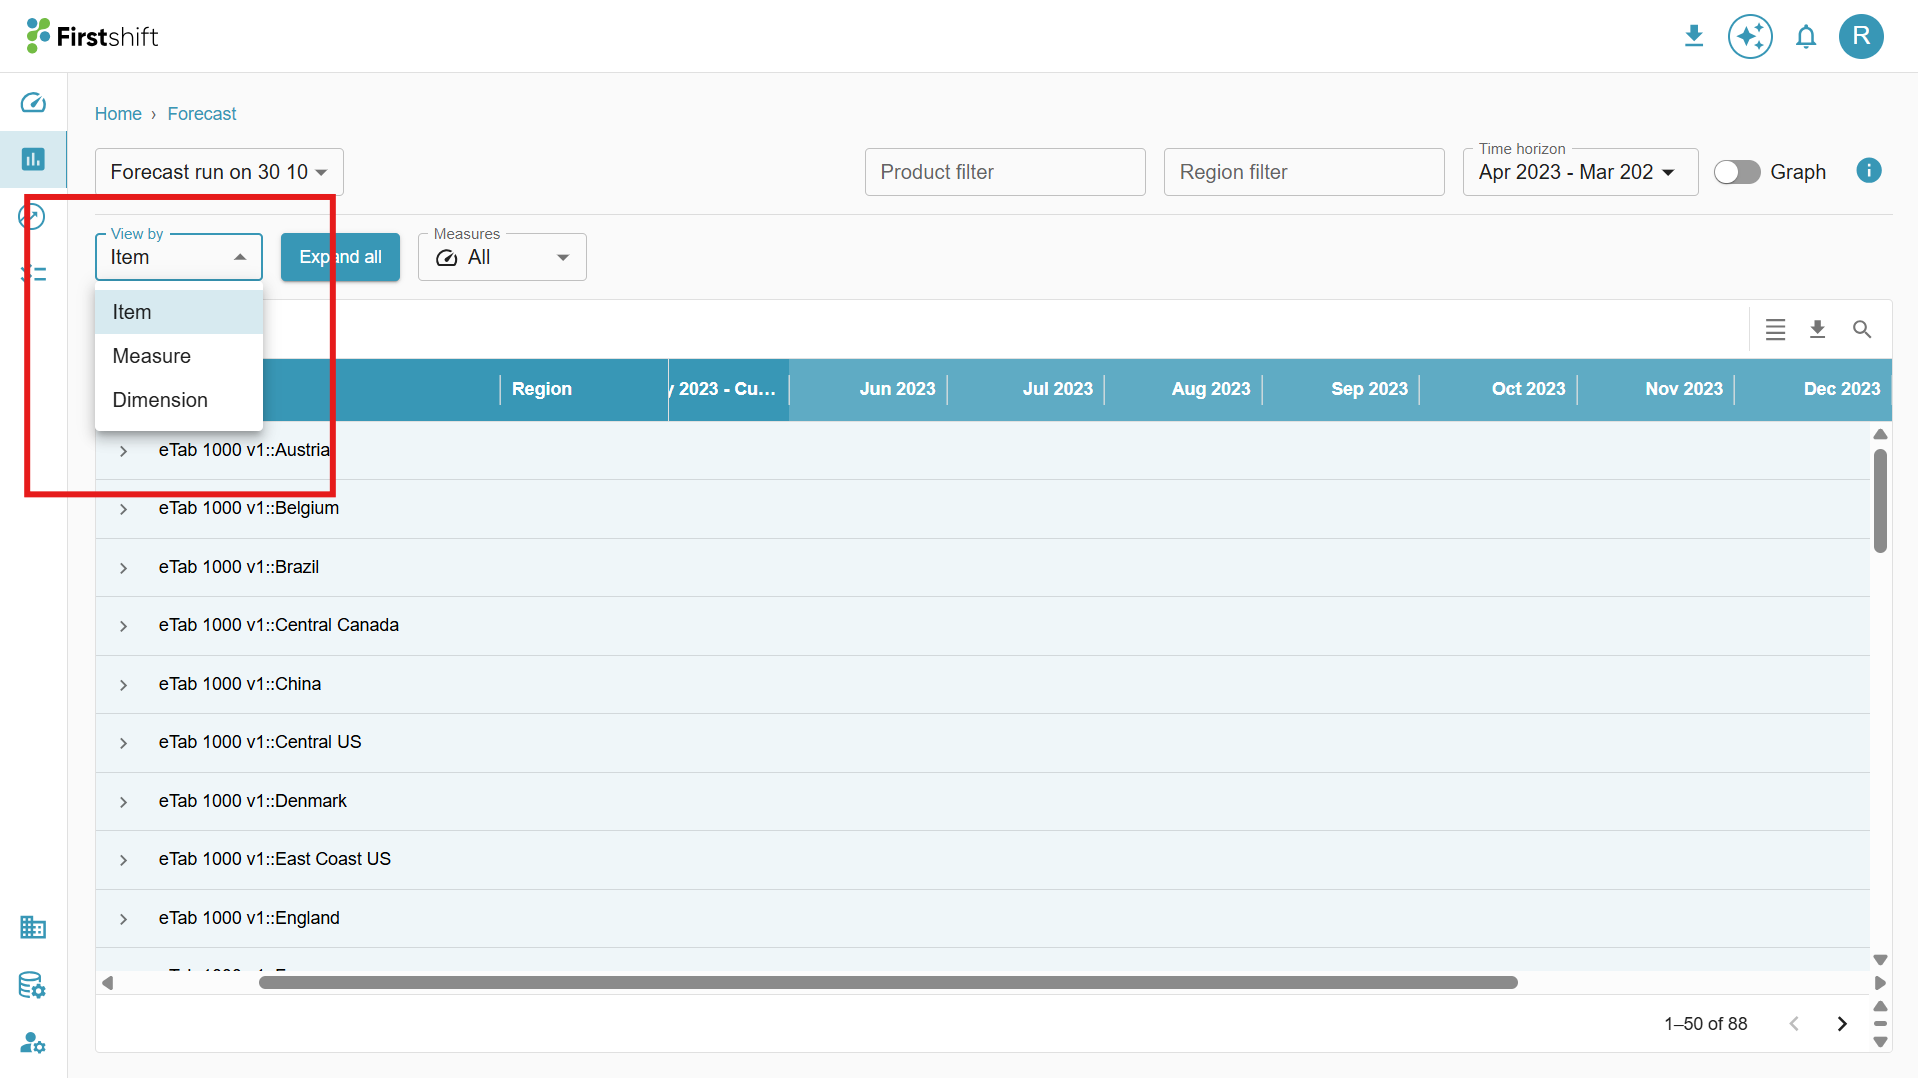
View by Item:
By default, the Item View is the selected view in the Multi-Item View. In this view, the hierarchy level chosen during the Forecast creation is displayed as a header.
Example: If the selected items during creation include Product and Region, the hierarchy level will be:
Product::Region::All::All. The Item View header will reflect selected values, such as Etab::Austria::All::All.
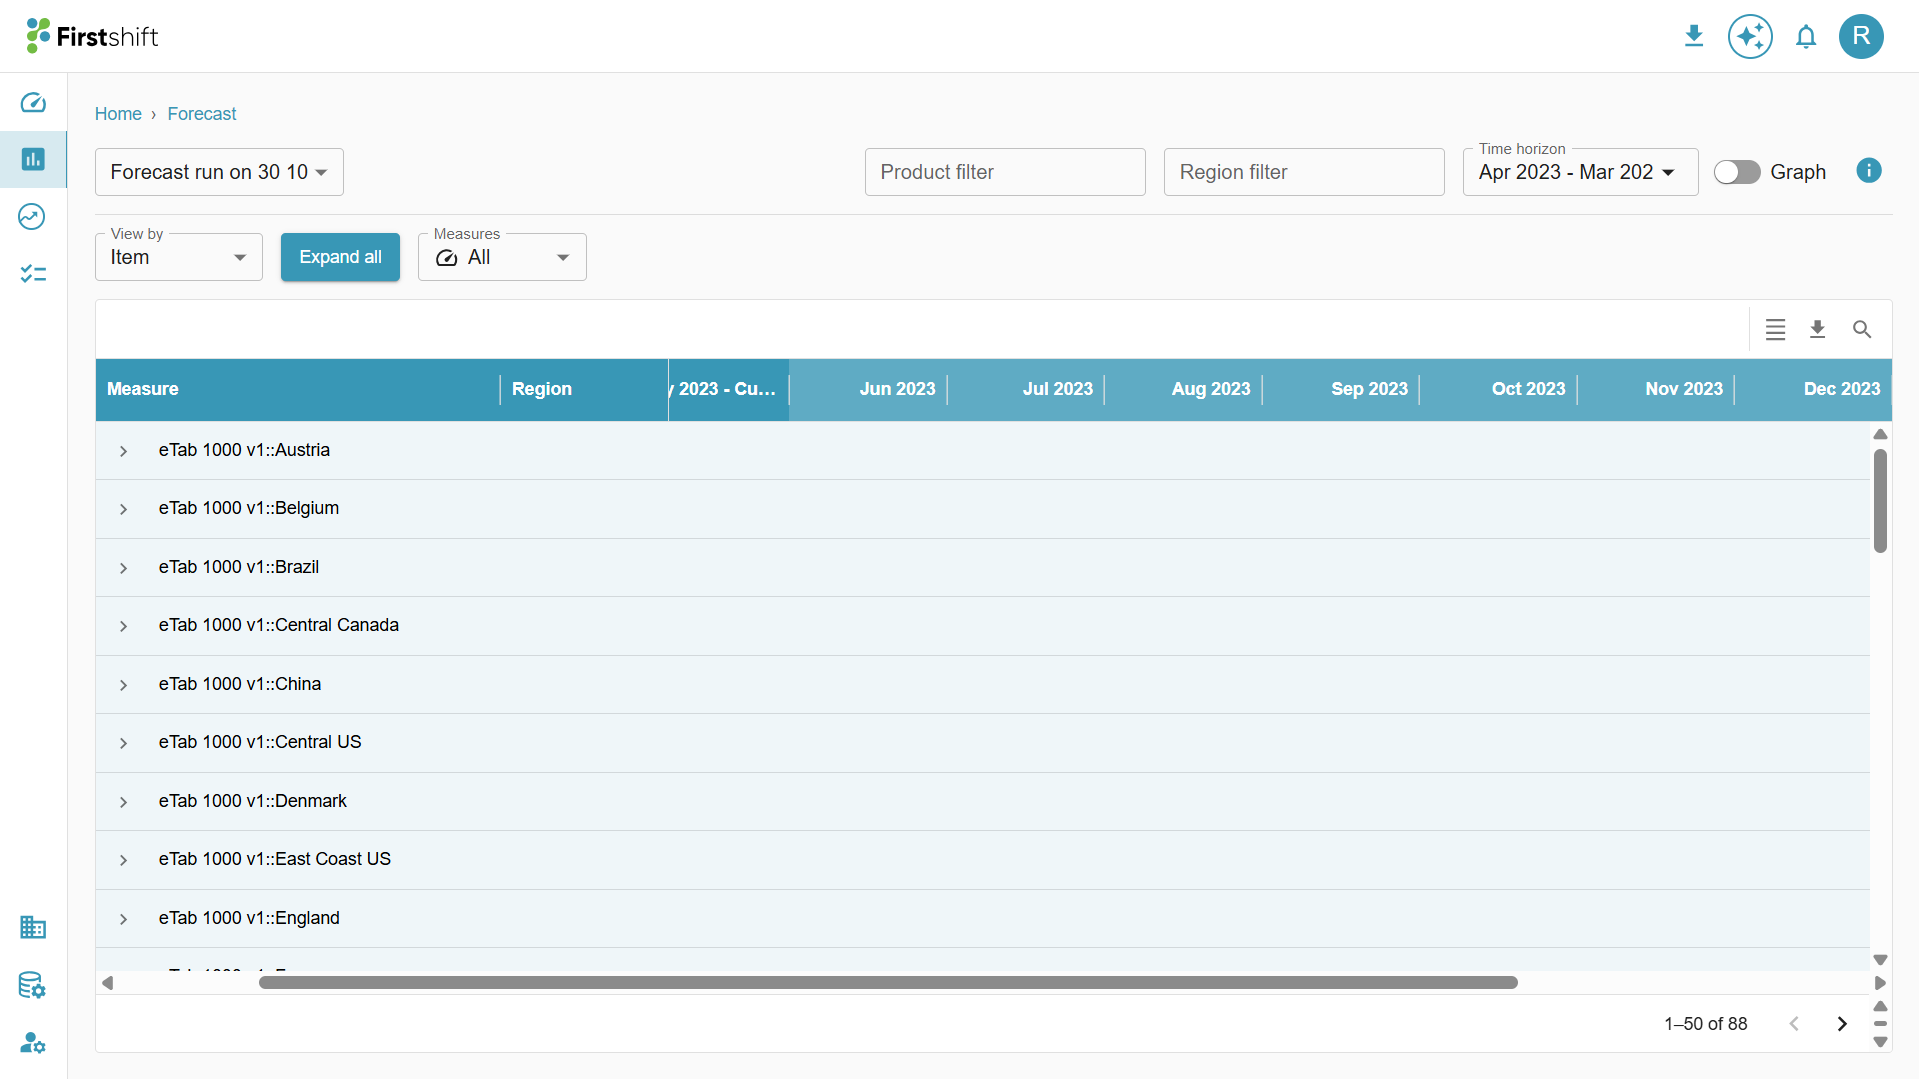
View by measure:
The selected measures appear as headers in the Measure View, while the product values are displayed below them.
This view allows us to analyze the results based on the measures selected.
Example:
If the selected measure is Shipped units, the Measure View will be displayed as a header, and
Etab | Austria | All | All (Product and Region values below the measures).

View by Dimension:
The Dimension View organizes data based on products and measures, enabling a comparative analysis across multiple dimensions.
Example:
If the selected dimensions include Product and Region, and the measure is Sales Quantity, the Dimension View will display:
Product | Region | Measure.
Etab | Austria | Shipped units.
This view provides a comprehensive breakdown of data across various dimensions, helping in more granular analysis.

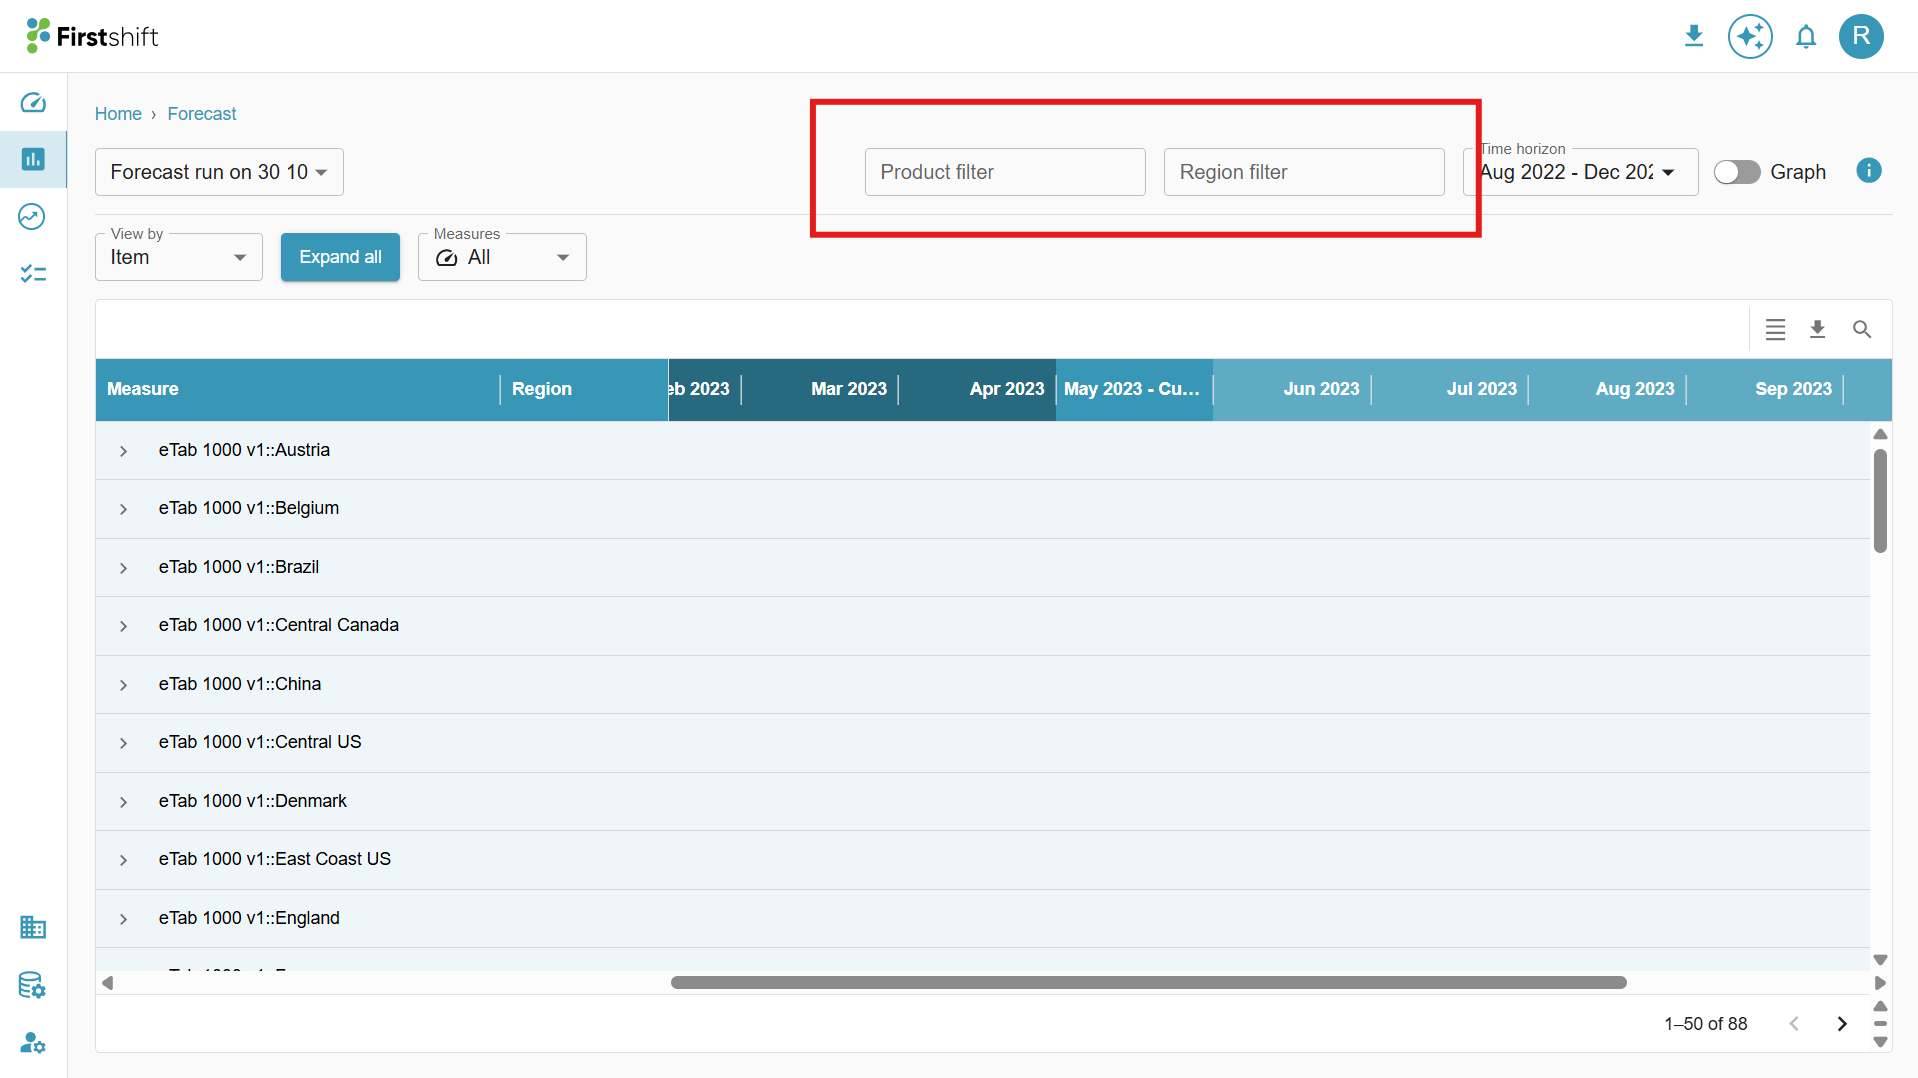
Expand All
By default, the table in the Multi-Item View is in collapsed mode, showing only the top-level data.
To view the results of the selected items in detail, click on the Expand All option.

This will expand the table, displaying results based on the hierarchy level chosen during the planning view creation.
You can also expand a single row by clicking on the arrow button provided next to each header. This allows you to view the detailed breakdown of that specific hierarchy level without expanding the entire table.

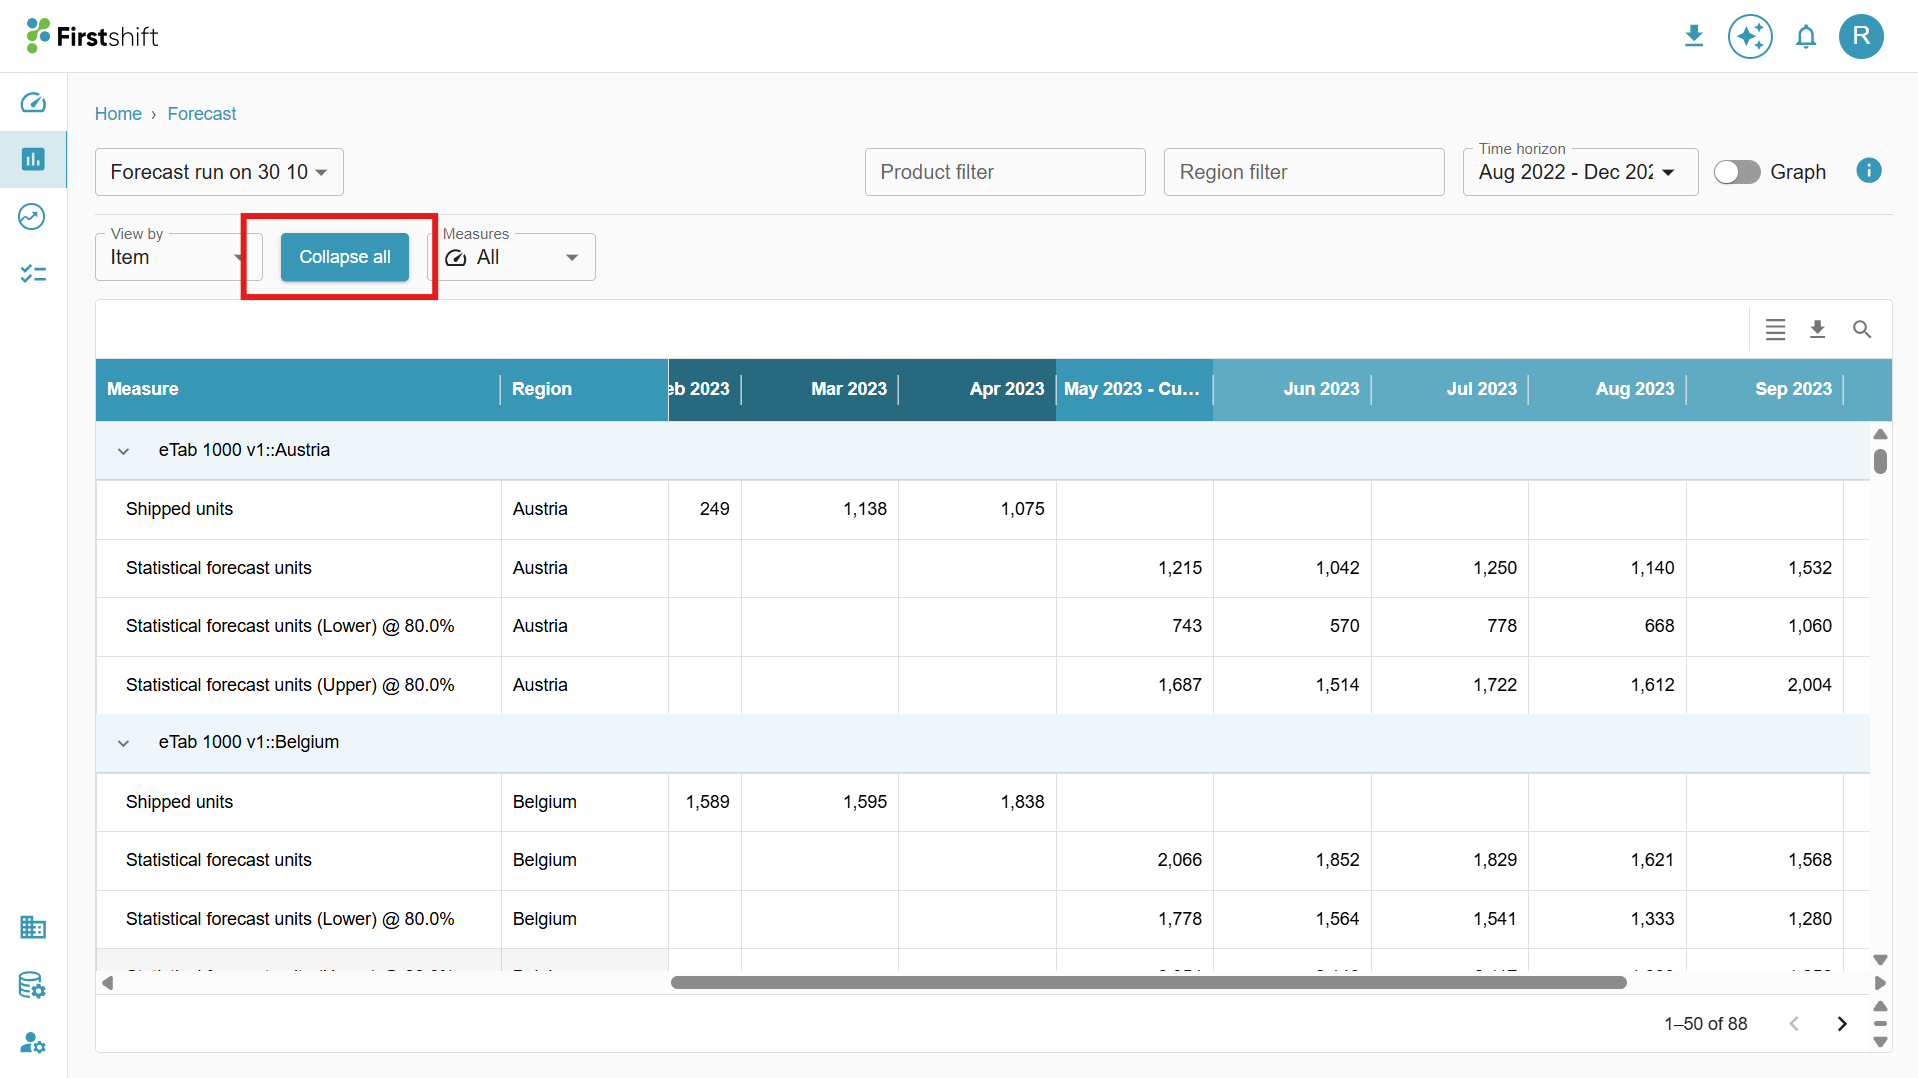
Collapse All
After clicking Expand All, the Collapse All button will be enabled.
Click on Collapse All to revert the table to its original format, hiding the expanded hierarchy levels.
This helps maintain a cleaner and more structured view by displaying only the top-level summary data.
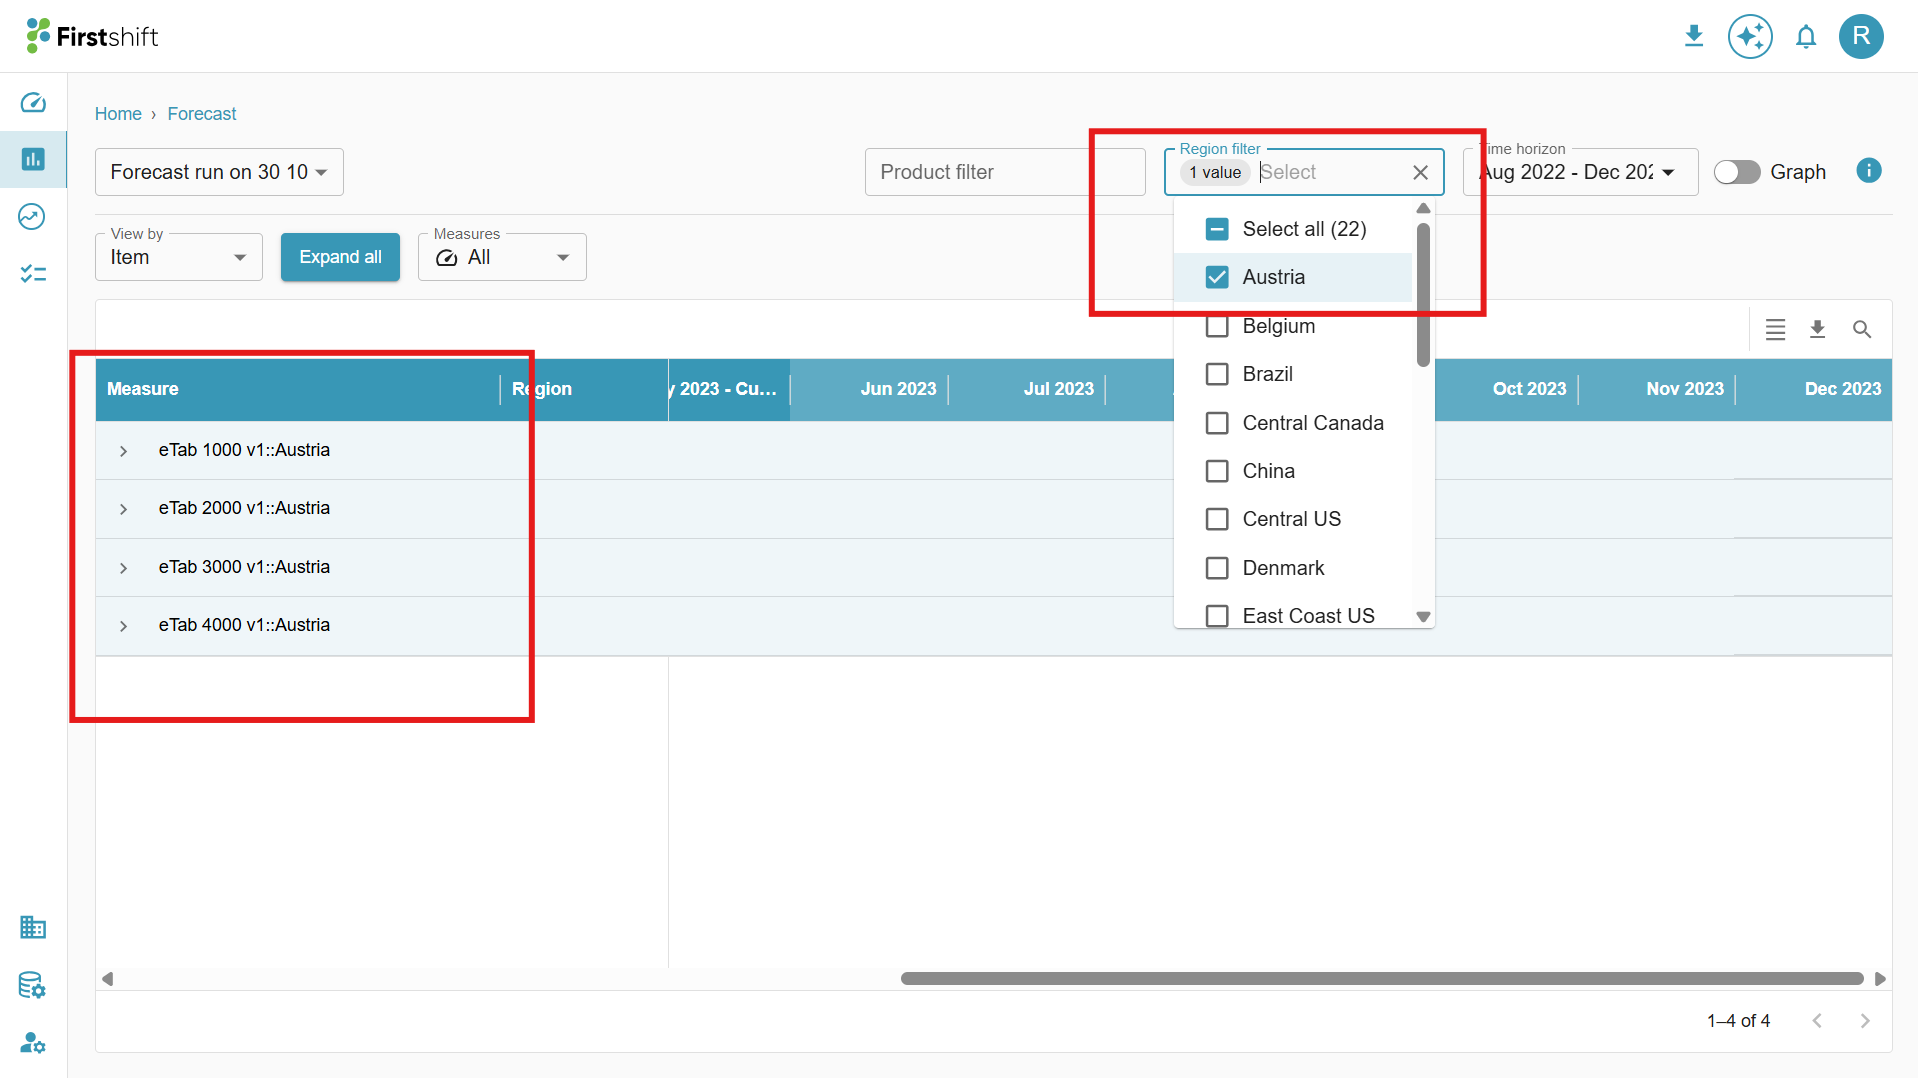
Hierarchy dropdowns
The Hierarchy Level Dropdowns in the image below allow users to filter and analyze data by selecting Product and Region attributes. These dropdowns help refine the Forecast by choosing specific products and Regions.
When items are selected from the dropdown, the table updates to display relevant data accordingly.
Search
The Search Option allows users to find specific headers within the Multi-Item View quickly.

Measures and time range
Measure: All input and output measures selected for forecast creation will be displayed in the measures dropdown, allowing users to filter and view only the required measures.

Clicking on the measures dropdown will display a list of all configured measures, allowing users to select and filter the measures they want to view in the table.

The measures selected from the dropdown will be displayed in the table along with their corresponding values.

Time range: The time range defines the period for which the data is displayed in the Forecast table; users can select a custom time range to view historical, current, or future data based on their analysis needs. The selected time range will determine the columns shown in the table.
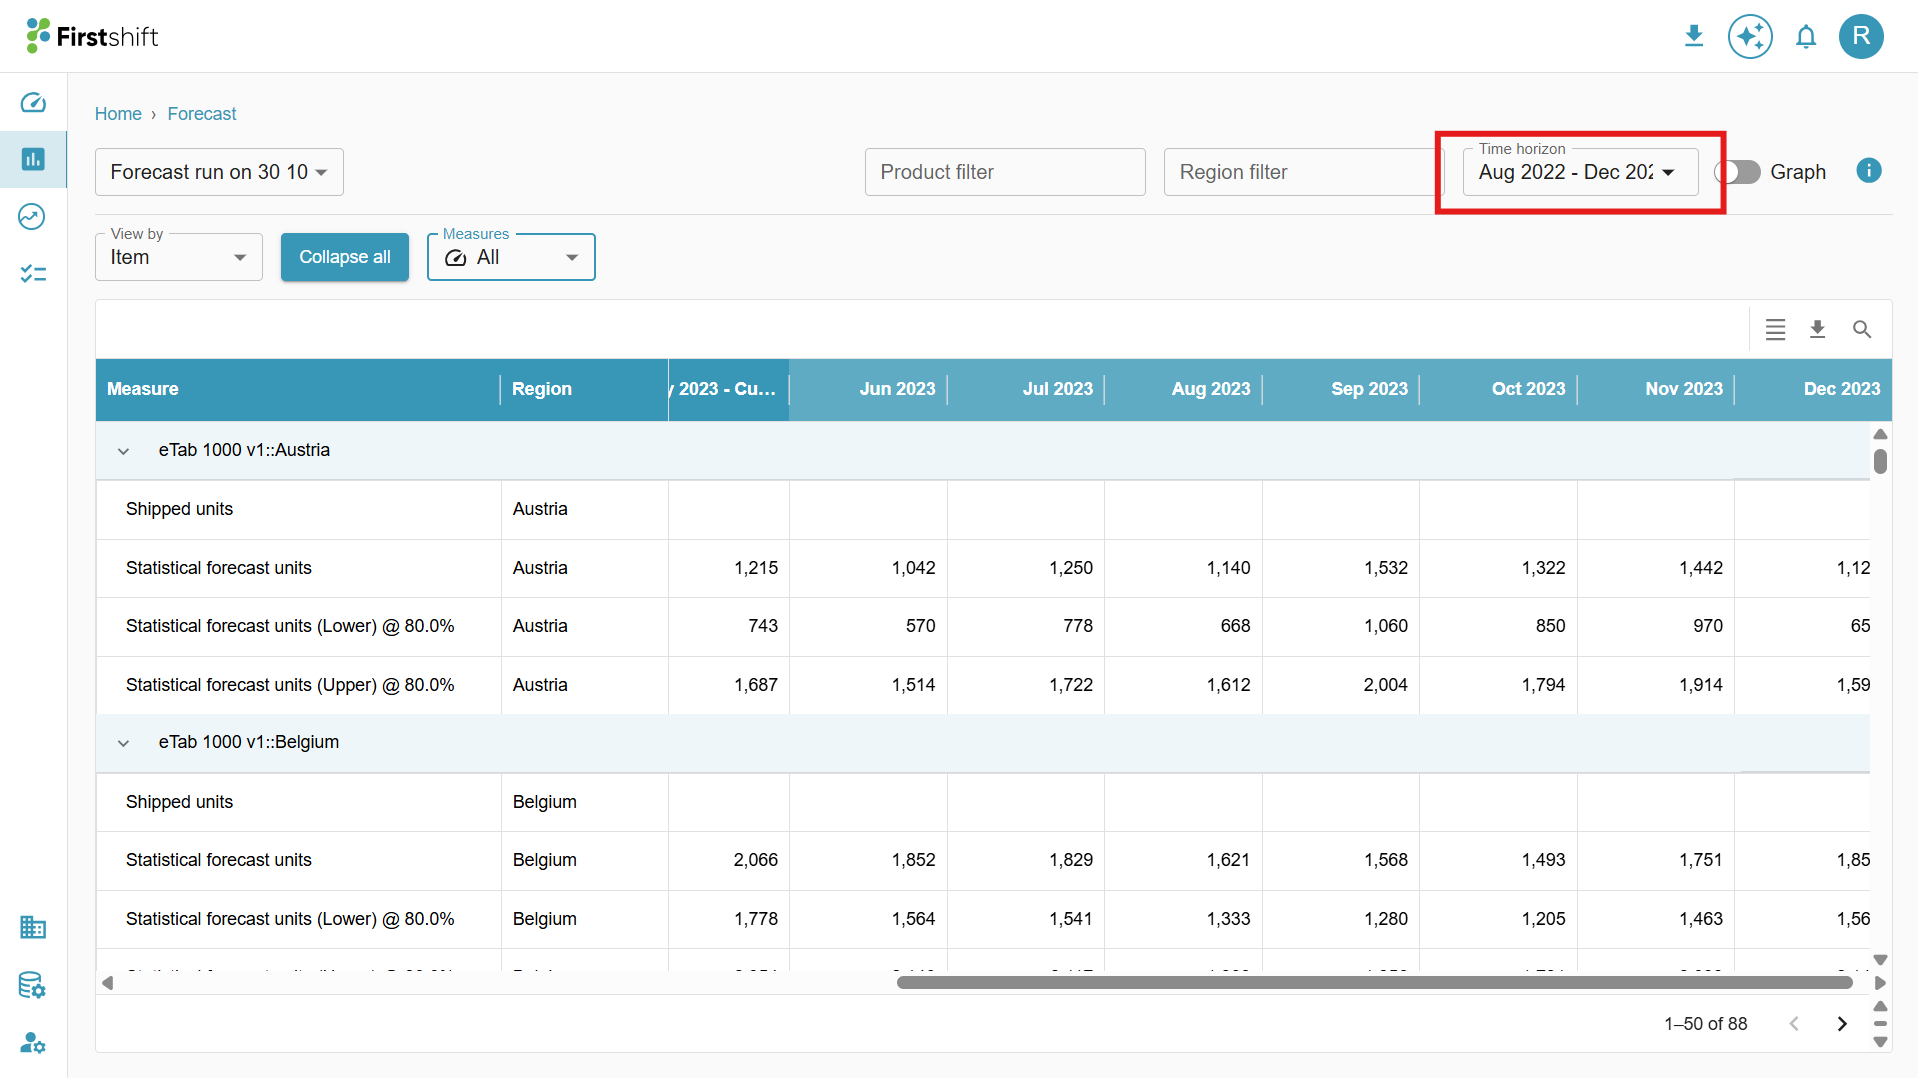
Clicking on the time range will open a dropdown allowing you to select the desired time period for viewing the table.

Download
The values on the forecast results page can be downloaded in a multi-item view. The downloaded files will show the values based on the preferences selected by the user.
Example: If the user selects only shipped units from the measures dropdown and selects a custom time range from Apr 23 to Jun 23, the downloaded file will show the shipped units' measures and data from Apr 23 to Jun 23. Similarly, the downloaded sheet will show results based on the user preferences, such as expand all or collapse all, selected hierarchy level, selected view by, etc.
Information
The information related to the forecast creation will be shown in the info panel. To access this panel, click the Info button in the multi-item view below.
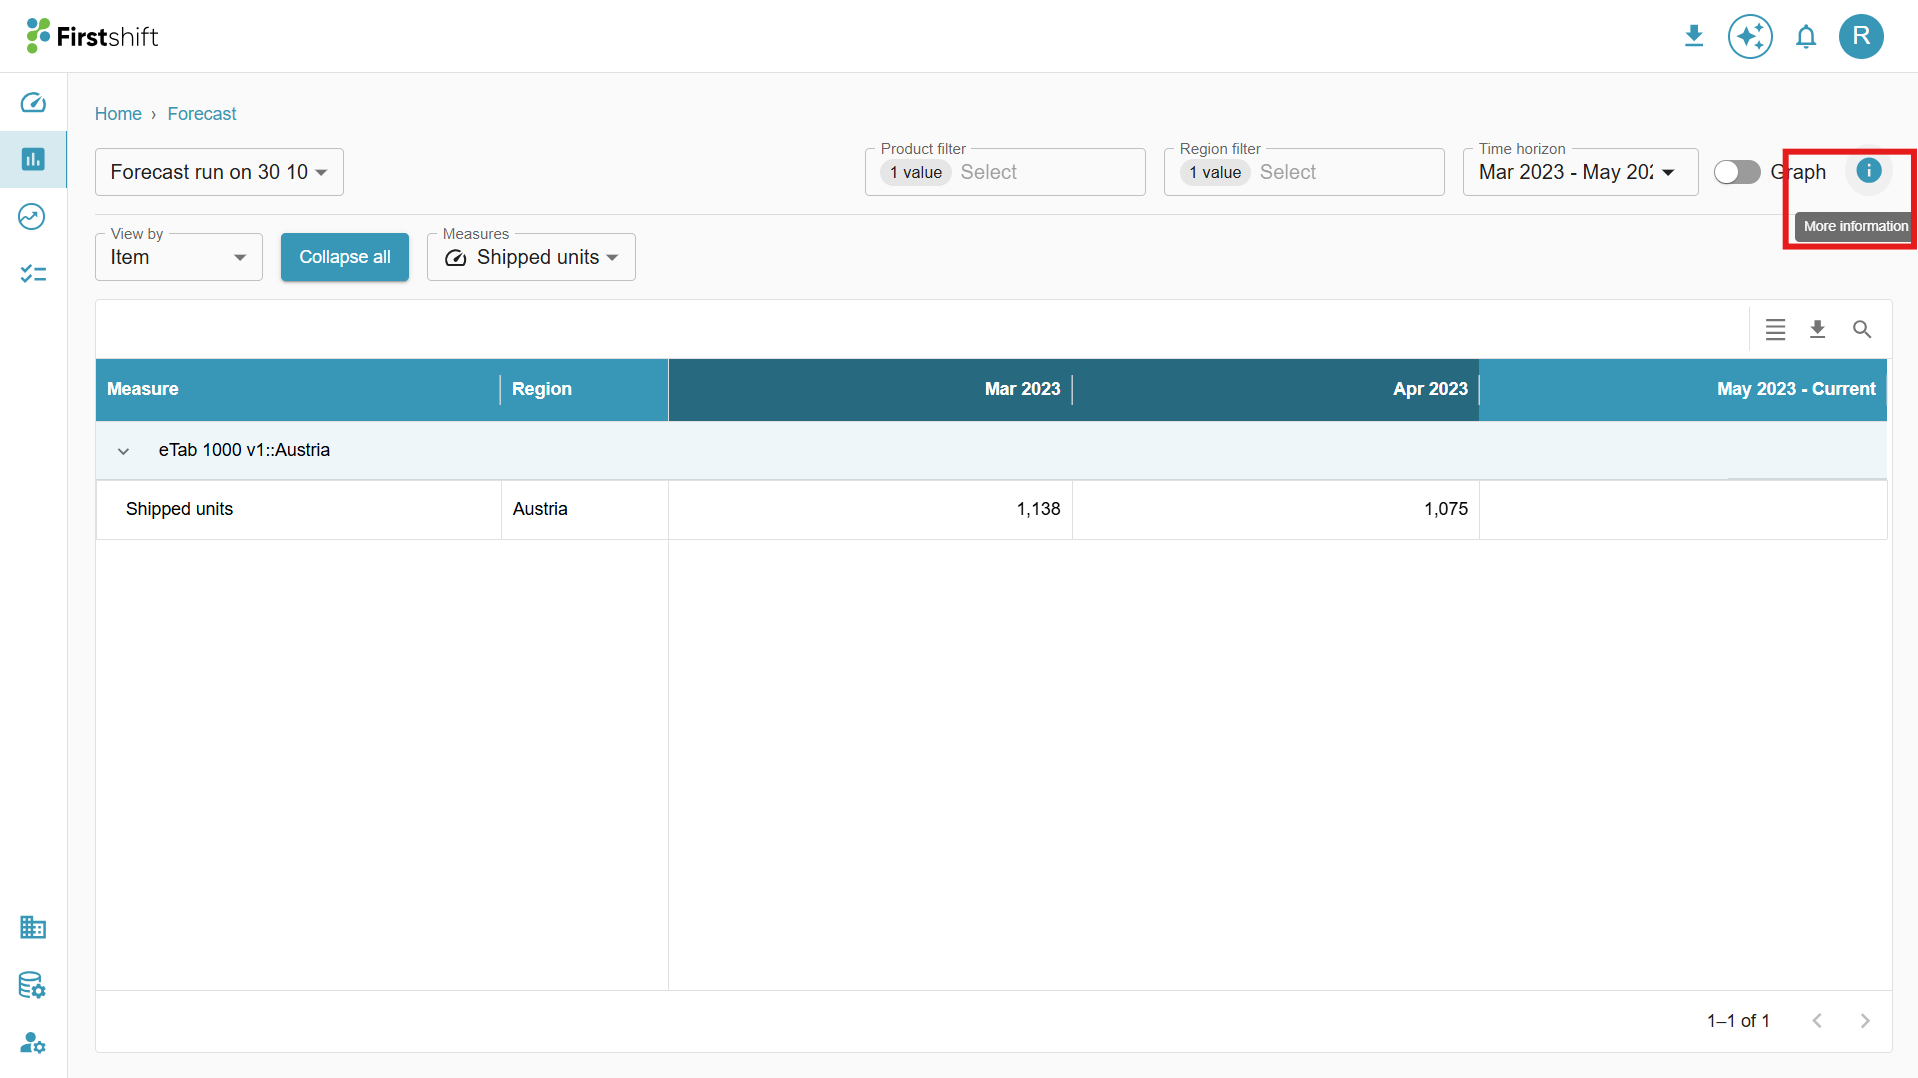
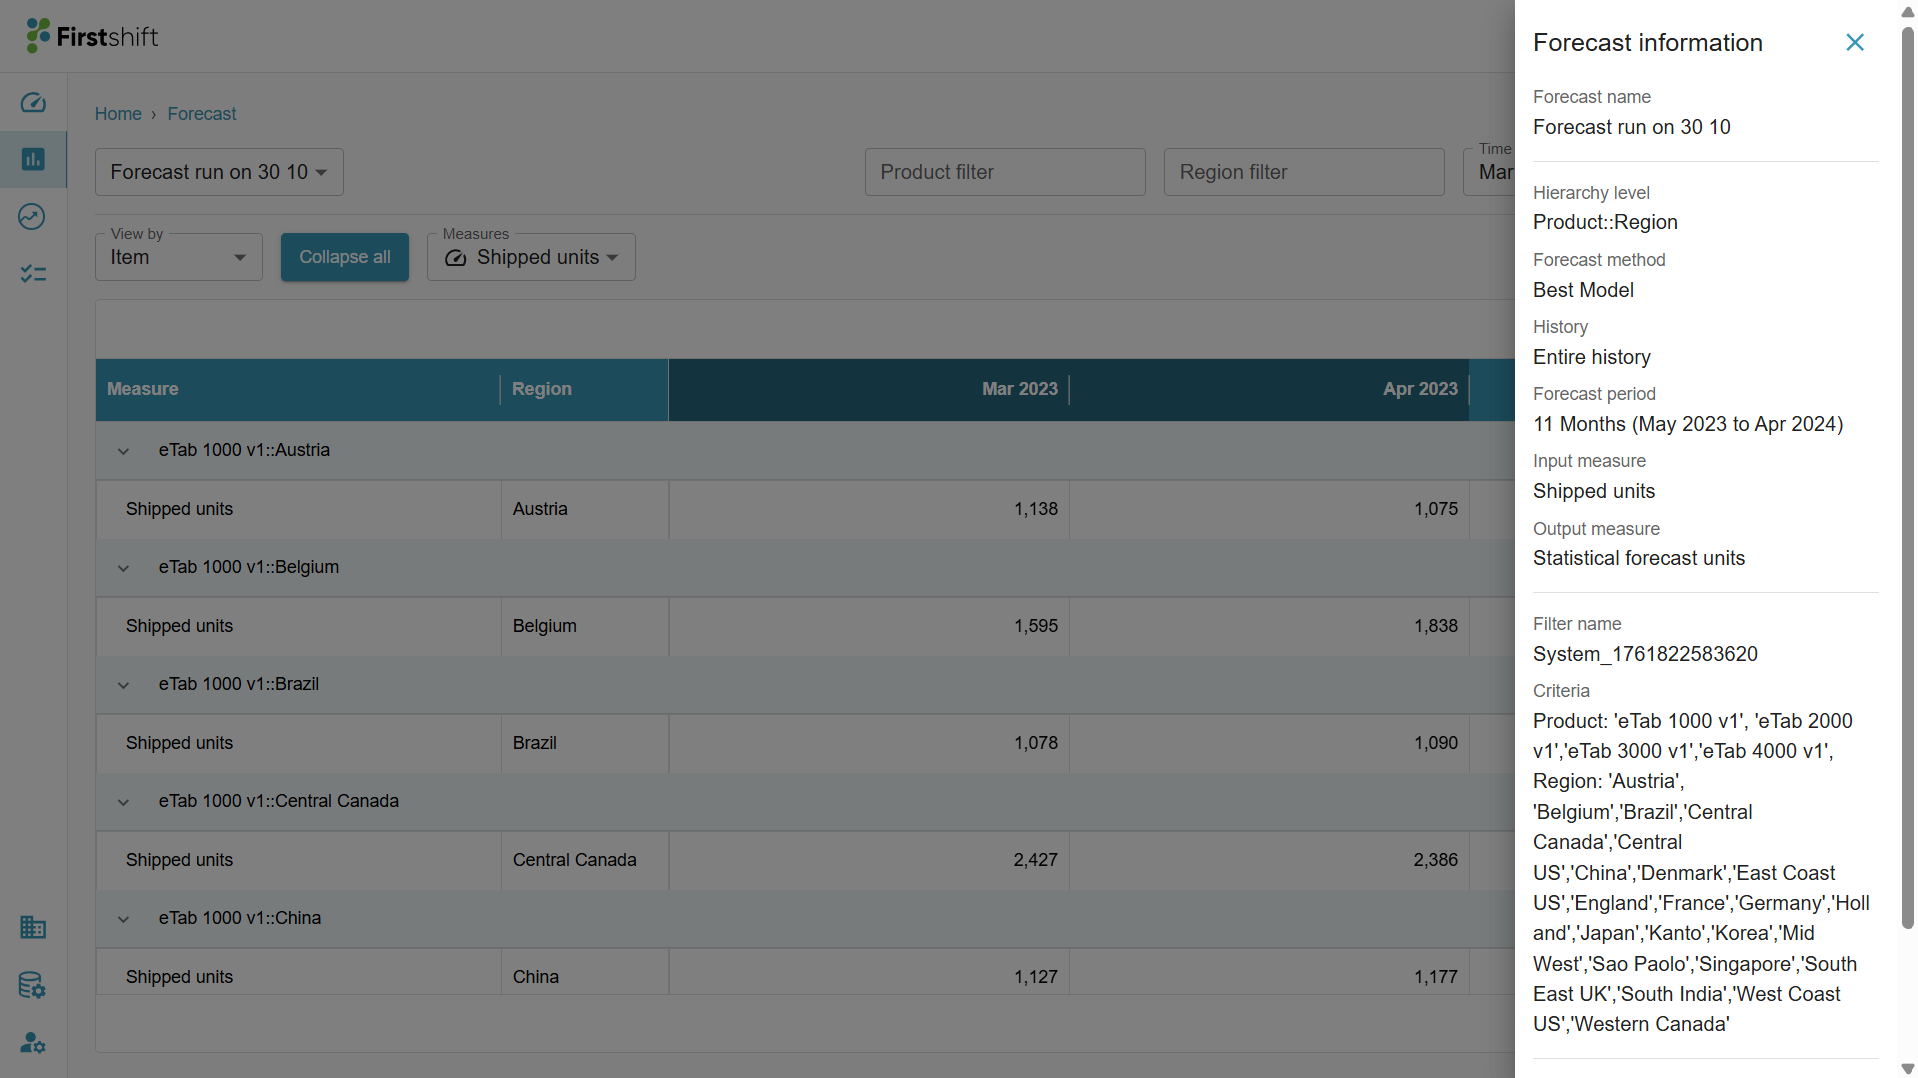
When you click on an info button, a side panel will appear, displaying all the key details of the created forecast, such as forecast name, parameters, filters applied, and last run details.
Single-item view features
The Single-Item View is similar to the Multi-Item View, but it provides detailed information about a single item at a time. It displays the item's data in a table, graph, and Key Performance Indicators (KPIs) for a more focused analysis.
To access the Single-Item View, click on the name of the created forecast. This will open a detailed view of a single item.
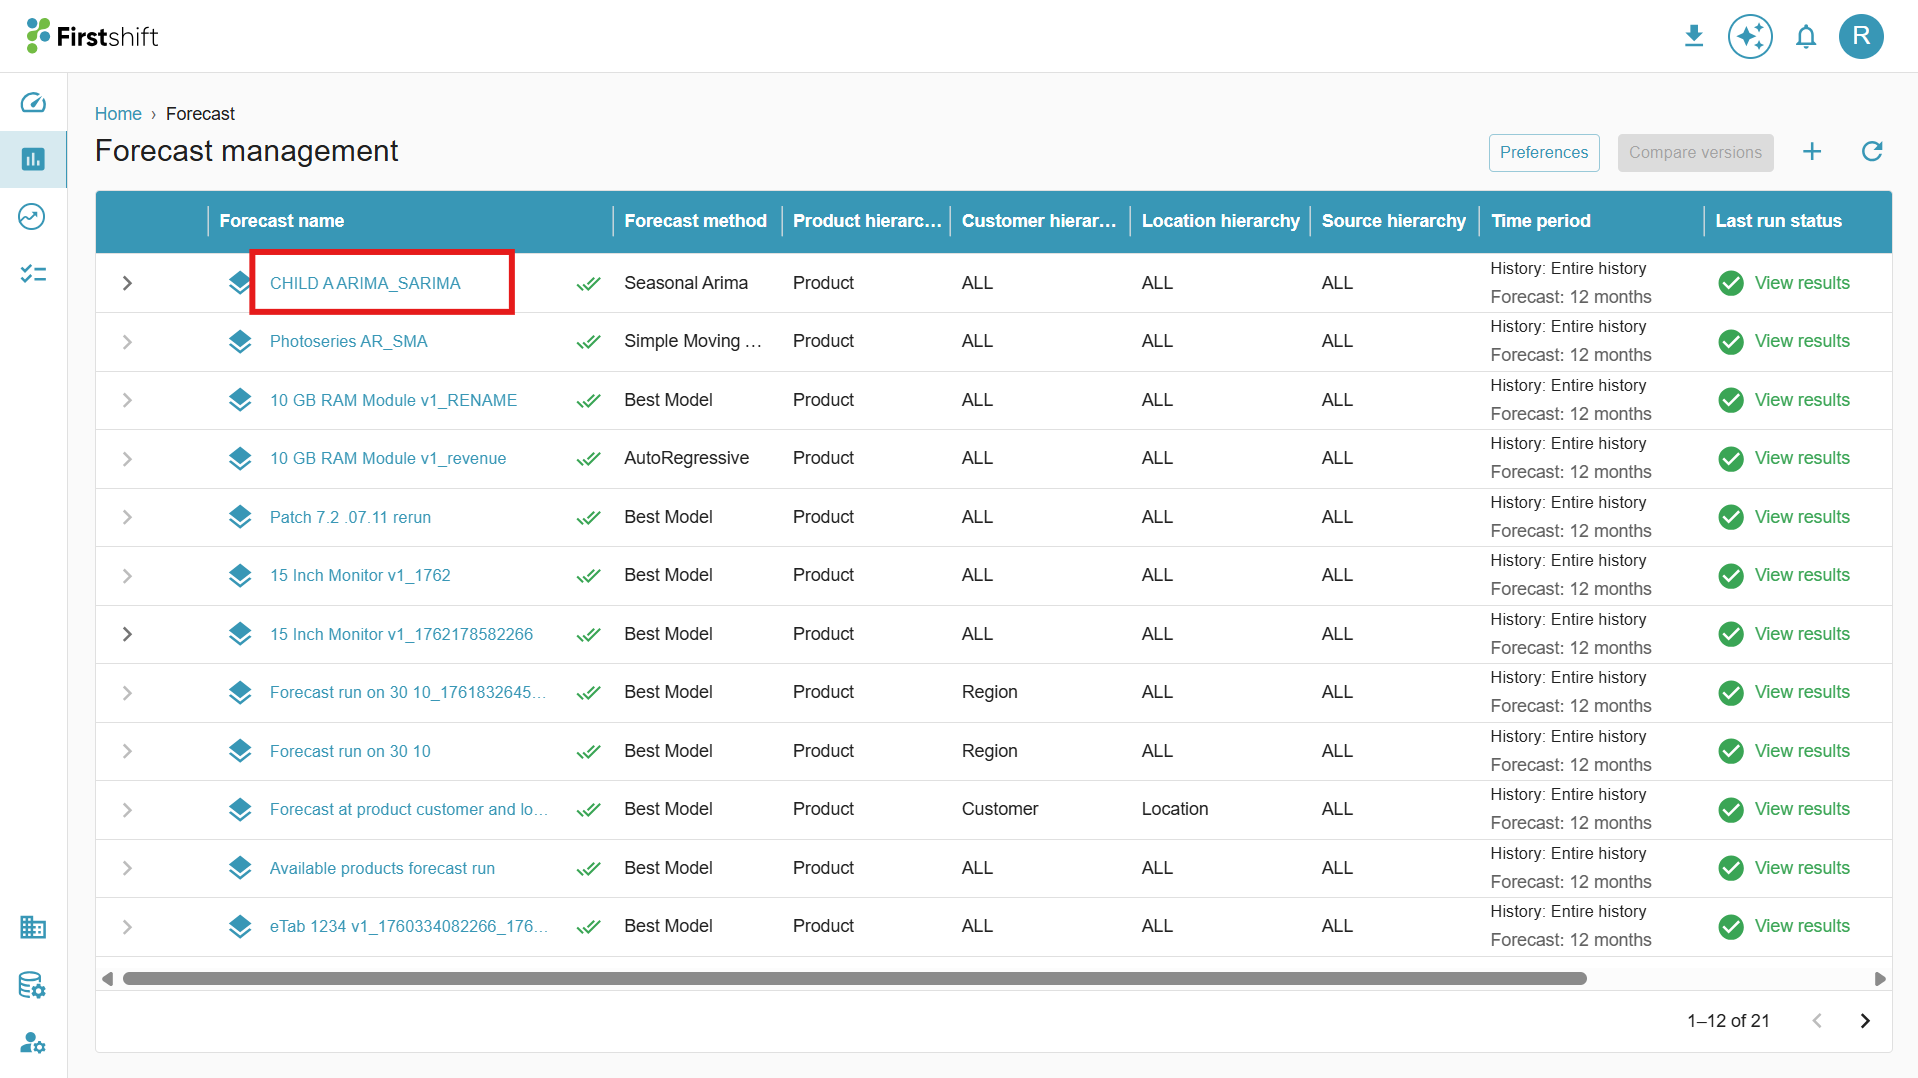
Clicking on the name of the Forecast will open a detailed page displaying the single-item view, as shown below.

The features in the single-item view are the same as those in the multi-item view, but they provide a detailed focus on a single item at a time.
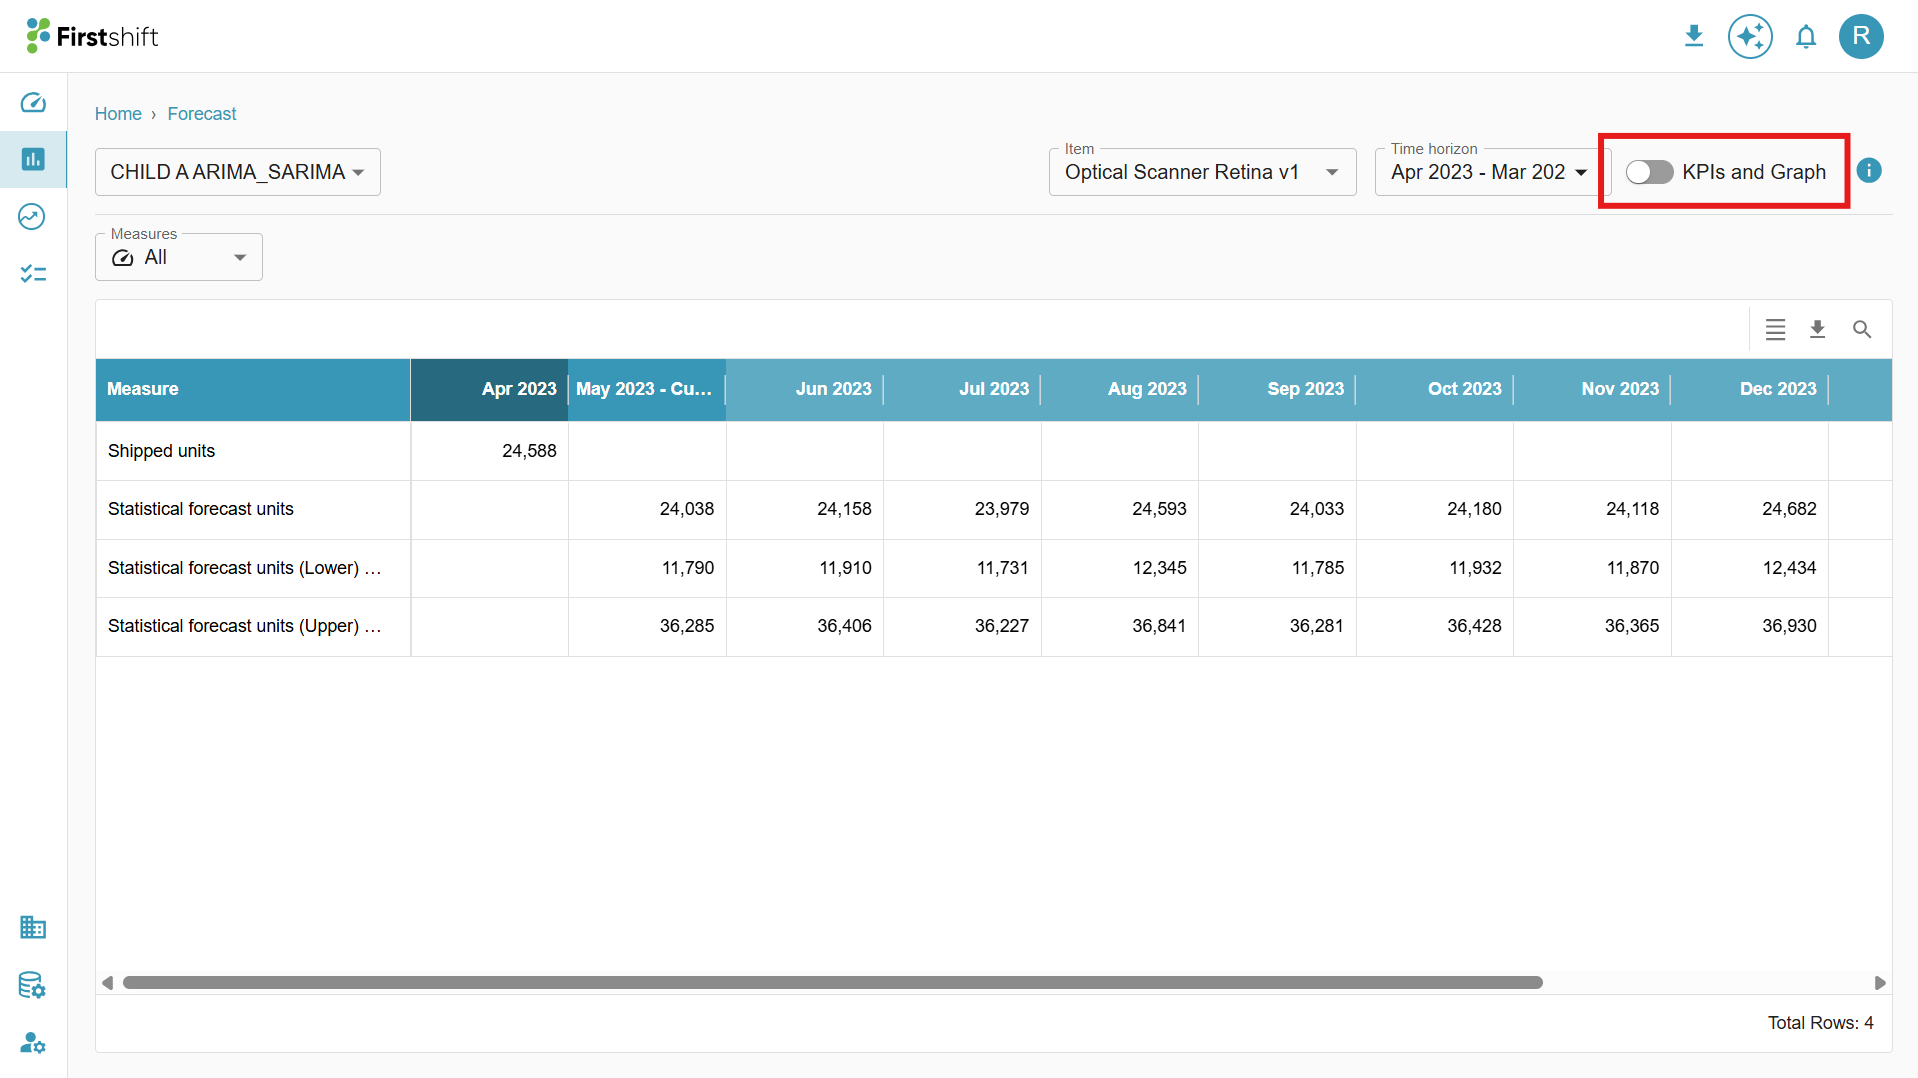
Graph and KPIs
By default, the graph and KPIs in the single-item view will be disabled. Graph and KPIs can be enabled together with the help of the toggle.
KPIs: Enabling the KPIs will display error metrics values of the created forecast. MAD, MAPE, SMAPE, MASE, and RMSE are the error metrics available in the firstshift. AI. Error metrics will show the accuracy of the forecast results.
When the toggle is enabled, all the values in the table are visually represented in the graph and error metrics will displayed, offering a clear and structured overview of the data.
Error metrics help evaluate the accuracy of a forecast by measuring the difference between actual and predicted values.
MAD(Mean Absolute Deviation): Measures the average absolute difference between actual and forecasted values.
A lower MAD indicates a better forecast with fewer deviations.
It treats all errors equally, regardless of direction.
MAPE (Mean Absolute Percentage Error): Measures the average absolute percentage error between actual and forecasted values.
A lower MAPE means a more accurate forecast.
SMAPE (Symmetric Mean Absolute Percentage Error): A modified version of MAPE that accounts for both forecast and actual values, reducing bias.
Ranges from 0% (perfect) to 200% (worst case).
Applicable when actual and forecast values are close to zero.
MASE (Mean Absolute Scaled Error): Compares the forecast error to the error of a naïve benchmark method (e.g., a simple moving average).
MASE < 1 → The forecast is better than the naïve method.
MASE > 1 → The forecast is worse than the naïve method.
RMSE (Root Mean Squared Error): Measures the square root of the average squared differences between actual and forecasted values. A lower RMSE indicates a more accurate forecast.
Select item dropdown
You can easily navigate between different planning items within the single-item view using the Select Item dropdown. Clicking on the Select Item field will open a drop-down containing all the selected items for the forecast. This allows you to switch between items without exiting or reloading the page.

Clicking on the Select Item field will open a drop-down displaying all the selected items for the forecast, allowing you to switch between them seamlessly.

A search option is available within the Select Item dropdown, allowing you to quickly find a specific item by typing its name or relevant keywords.

Was this article helpful?
That’s Great!
Thank you for your feedback
Sorry! We couldn't be helpful
Thank you for your feedback
Feedback sent
We appreciate your effort and will try to fix the article