TABLE OF CONTENTS
Overview
The Aggregate View provides a high-level summary of Proposed Orders, grouping them by key hierarchy attributes such as Product, Location, and Source.
This view helps you analyze demand, supply, and cost at a consolidated level, with the ability to drill down into detailed order lines when needed.
Aggregated view
The Aggregate View supports grouping Proposed Orders using the following hierarchy dimensions:
Product
Location
Source
Note: Customer-based grouping is intentionally excluded because customers are not part of Proposed Orders or Replenishment logic.
Check the illustration below to navigate to the aggregated view of the proposed orders.

Default grouping
When you open the Aggregate View for the first time, the table will show the Product hierarchy grouped by orders.
- The first column displays the selected grouping dimension:
- If grouped by Category → first column lists Category names
- If grouped by Subfamily → first column lists Subfamily names
For each aggregate group, the application displays:
- Number of Products in the group
- Number of Proposed Orders
- Number of Sources associated with that group
You can select a different dimension from the view by option. The dropdown will appear when you click the View by option.
Example: When View By = Source is selected:
All Proposed Orders are grouped by source or supplier.
All orders from that source are consolidated under a single aggregated row.
KPI columns
The aggregated view of the proposed orders will display the KPI columns mentioned below.
- Suggested order quantity(SOQ): SOQ in the aggregated table shows the sum of all the orders within the selected group.
- Average coverage: Displays the average number of coverage weeks for all orders in the selected group.
- Average weeks of supply: Displays the average number of Weeks of supply for all orders in the selected group.
- Line amount: Displays the sum of the line amounts generated for the consolidated order lines.
- Average lead time: Displays the average value of the lead time.
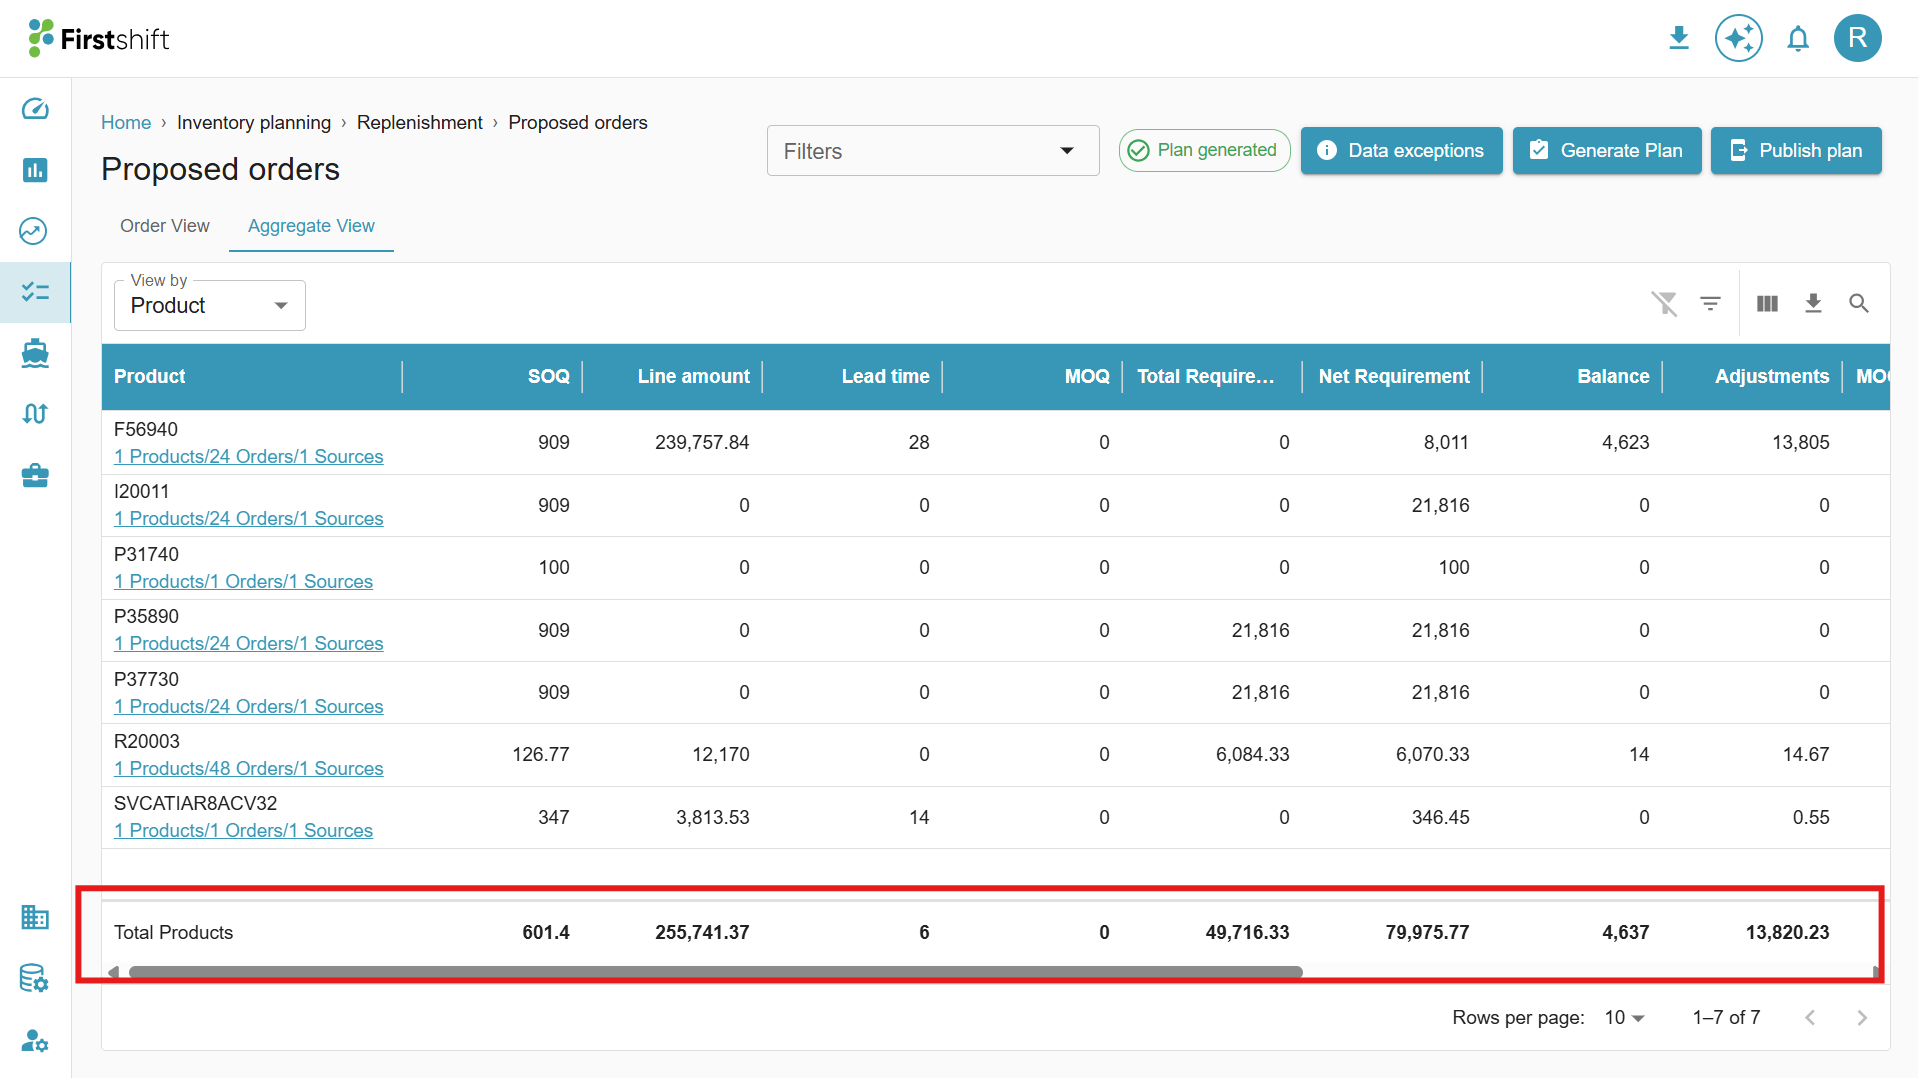
Table options
Filters
You can apply column-level filters to narrow down the aggregated results displayed in the table. Filters allow you to quickly focus on specific products, locations, sources, or any other attribute shown in the table.
Columns
Using the Columns option, you can choose which fields should be visible in the table. This helps you personalize the view by hiding unnecessary data and retaining only the attributes relevant to your workflow.

Download
The aggregated table view can be exported using the Download button. This allows you to download the current table content for offline review, reporting, or further analysis.

Search
The Search option lets you quickly locate any product within the aggregated results. Simply type the product name or identifier into the search bar to highlight matching records instantly.

Drill down of the aggregated view
The drill-down table displays all individual orders that contribute to the selected aggregated value. The application allows you to view detailed information behind the aggregated results through a drill-down option.
You can view the consolidated list of orders by clicking on the Orders link displayed in the aggregated table. The data shown in this view is based on the selection you made in the aggregated table.
The drilldown report will show all orders associated with the selection. In the drilldown table, you can search, filter, and download the data if required.

Was this article helpful?
That’s Great!
Thank you for your feedback
Sorry! We couldn't be helpful
Thank you for your feedback
Feedback sent
We appreciate your effort and will try to fix the article