TABLE OF CONTENTS
Introduction
This article explains how to access planning results in both the Single-Item View and Multi-Item View of the Planner Workbench. It also provides the steps required to configure the drilldown table hierarchy, enabling you to analyze planning data across different levels of hierarchy.
Graph
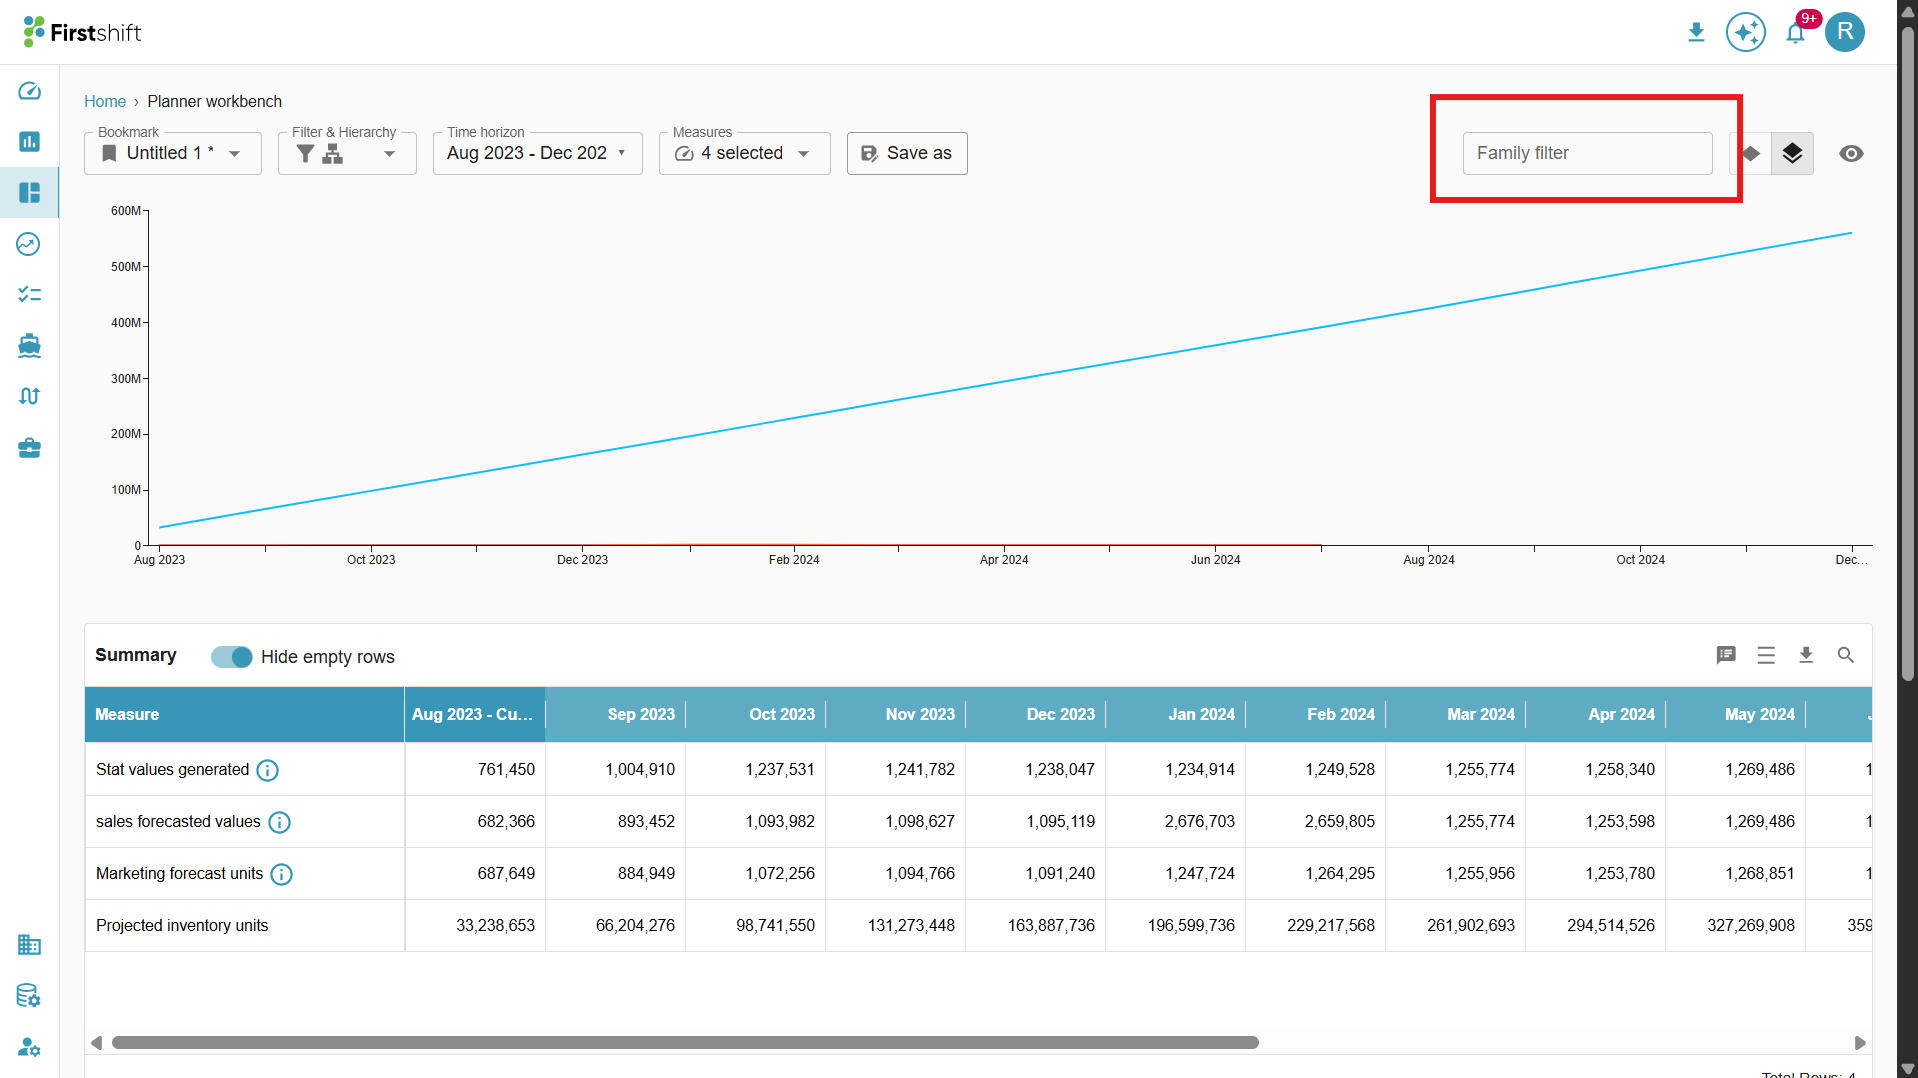
Displays data points based on the selected planning items and measures in the Planner View. It visually represents the time-series data across the selected time horizon, allowing you to analyze trends, comparisons, and performance over time.
The graph automatically updates whenever changes are made to the planning item selection, measures, time horizon, currency, or overrides, ensuring that the displayed information always reflects the most recent configuration.
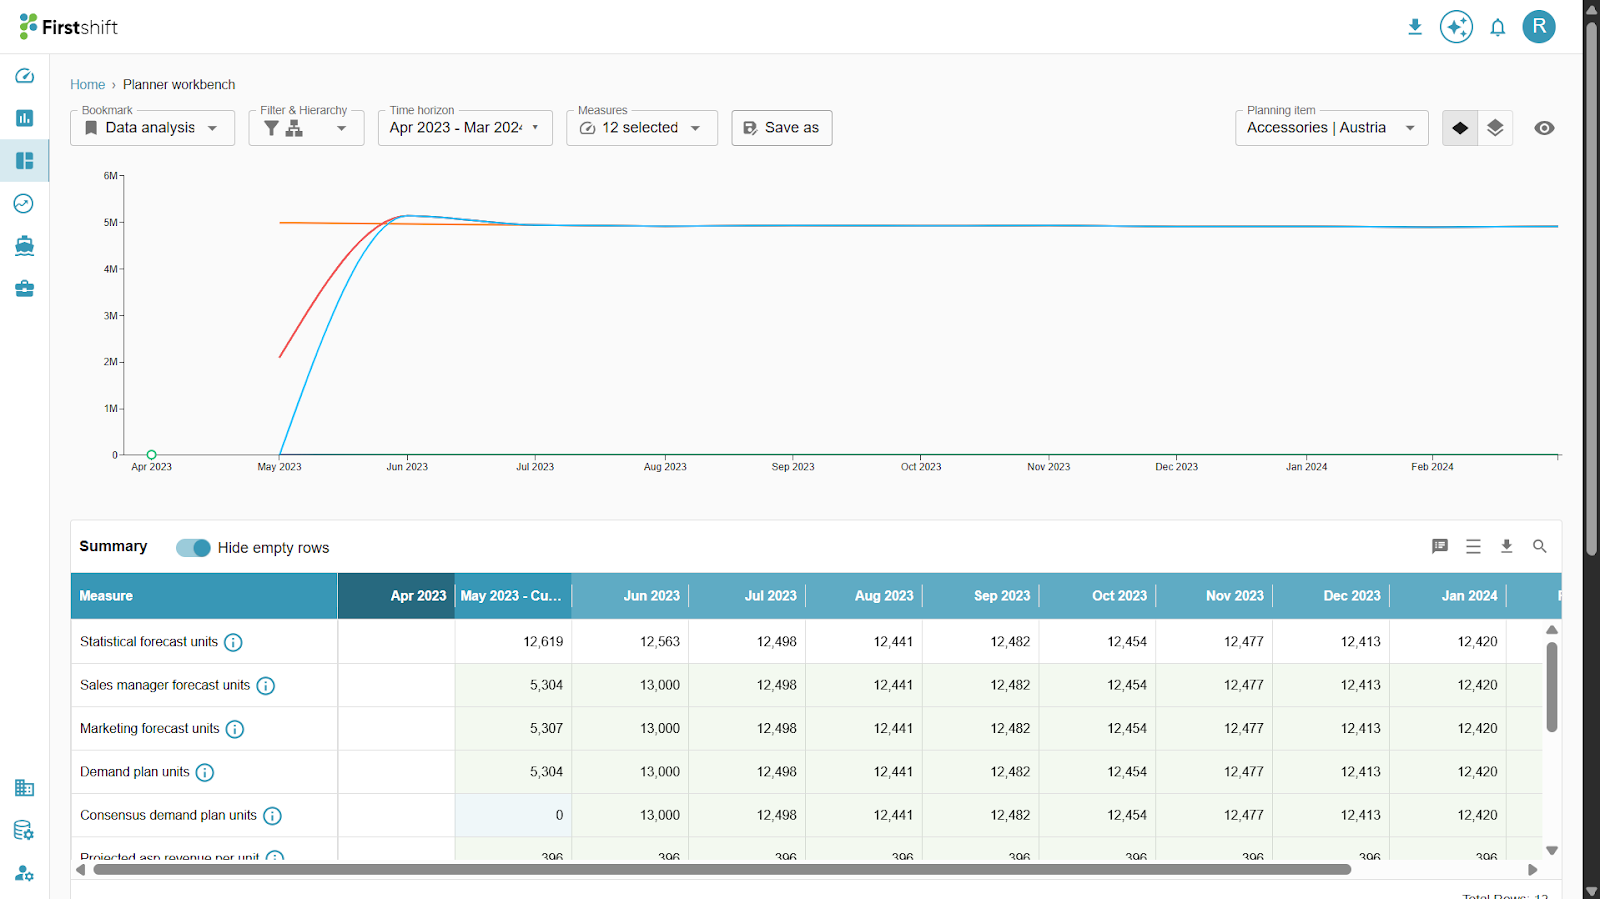
Summary table
The summary table provides an aggregated view of the selected planning item. All data points displayed in the graph are also reflected in the Summary Table, ensuring consistency between the visual and tabular representations. The values are shown across the selected time horizon and for the selected measures.
You can download the Summary Table data by clicking the Download button.
In the single-item view, all supported cell actions can be performed directly within the Summary Table. These actions include Edit, Multi-cell Edit, Reset, Audit, and other applicable cell-level operations, allowing users to modify, review, or track changes efficiently.
Details table
To view the disaggregated values of the selected planning item, you must choose a drilldown hierarchy in the Details Table. The drilldown hierarchy determines how the selected planning item is broken down into lower-level elements for detailed analysis.
The application restricts drilldown hierarchy selection to the initially selected hierarchy level. You cannot select the same level or any higher level than the hierarchy chosen for the bookmark. Higher-level hierarchies are displayed in a disabled state and cannot be selected. This ensures that the Details Table always shows data at a valid lower-level disaggregation relative to the selected planning level.
Example: The selected hierarchy level during bookmark creation is Family: All: All: All. The detail table shows that the higher levels are disabled state, and allows you to select the lower levels.
Hierarchy dropdowns
Hierarchy dropdowns are displayed based on the hierarchy levels selected in the drilldown table. These dropdowns allow you to filter the table data by selecting specific items within the hierarchy.
How It Works
When a hierarchy level is applied in the drilldown table, the application automatically displays a corresponding dropdown above the table. You can use these dropdowns to select an item within the hierarchy and refine the data displayed in the table.
Example: If the selected drilldown hierarchy is: Family: Region: All: All.
The application displays dropdowns for:
Family
Region
Using these dropdowns, you can select specific family and region values to filter the table results.
After selecting items from the hierarchy dropdowns, the table updates to display data corresponding to the selected hierarchy items.
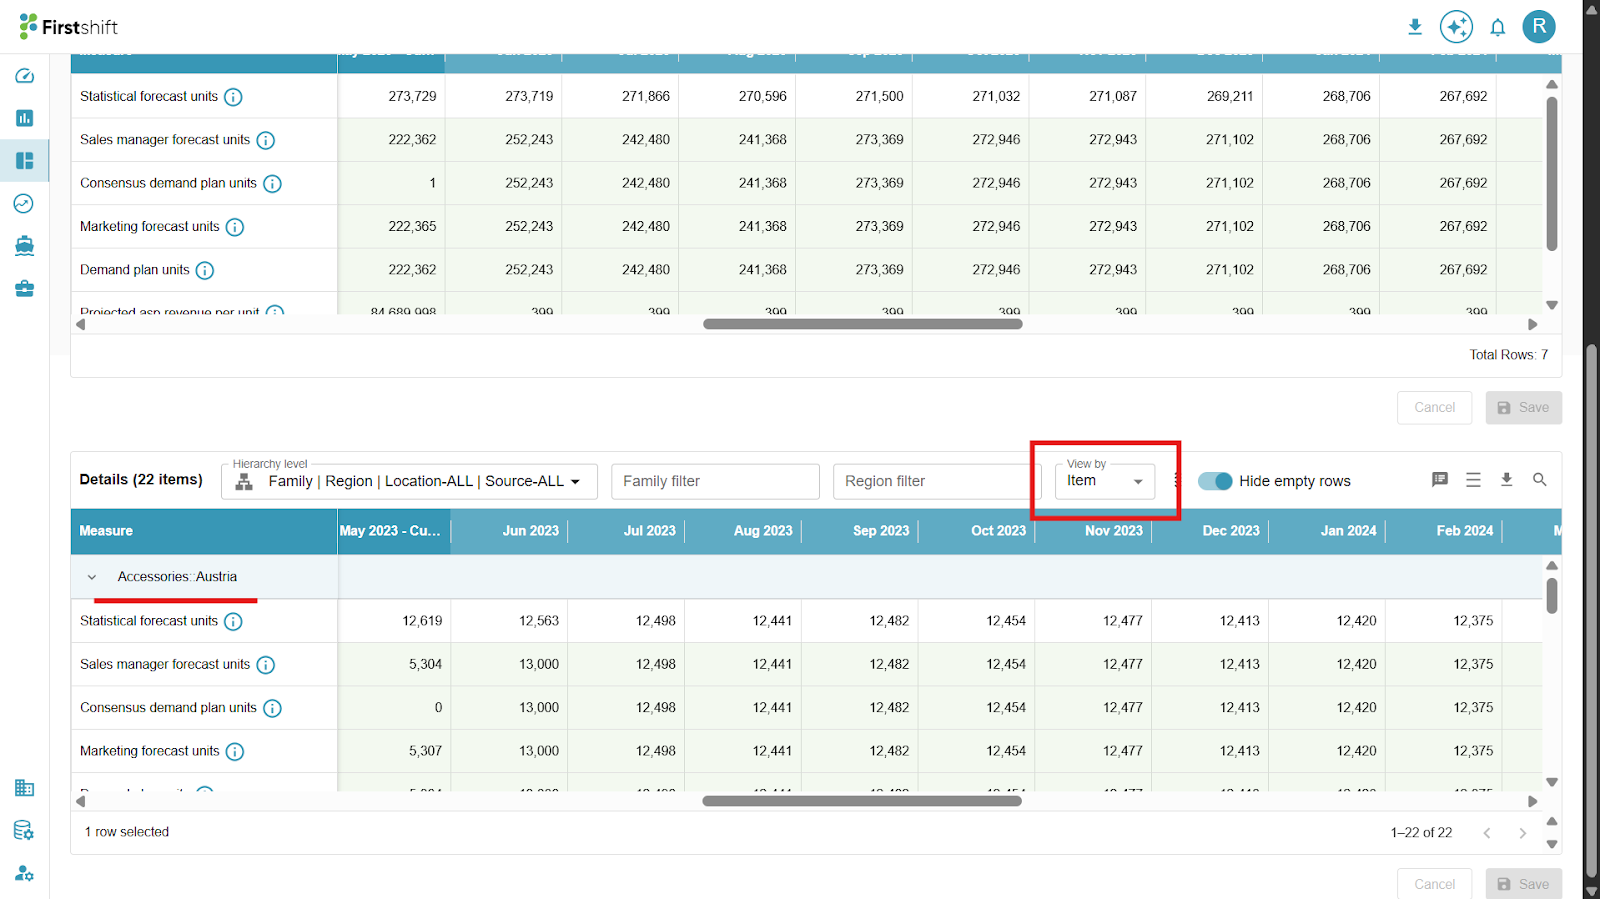
View by
View by Item: By default, the Item View is the selected view in the Details table. In this view, the hierarchy level chosen in the drill-down hierarchy is displayed as a header.
Example: If the selected drilldown hierarchy is Family: Region: All: All level, then the items will be displayed as the header.
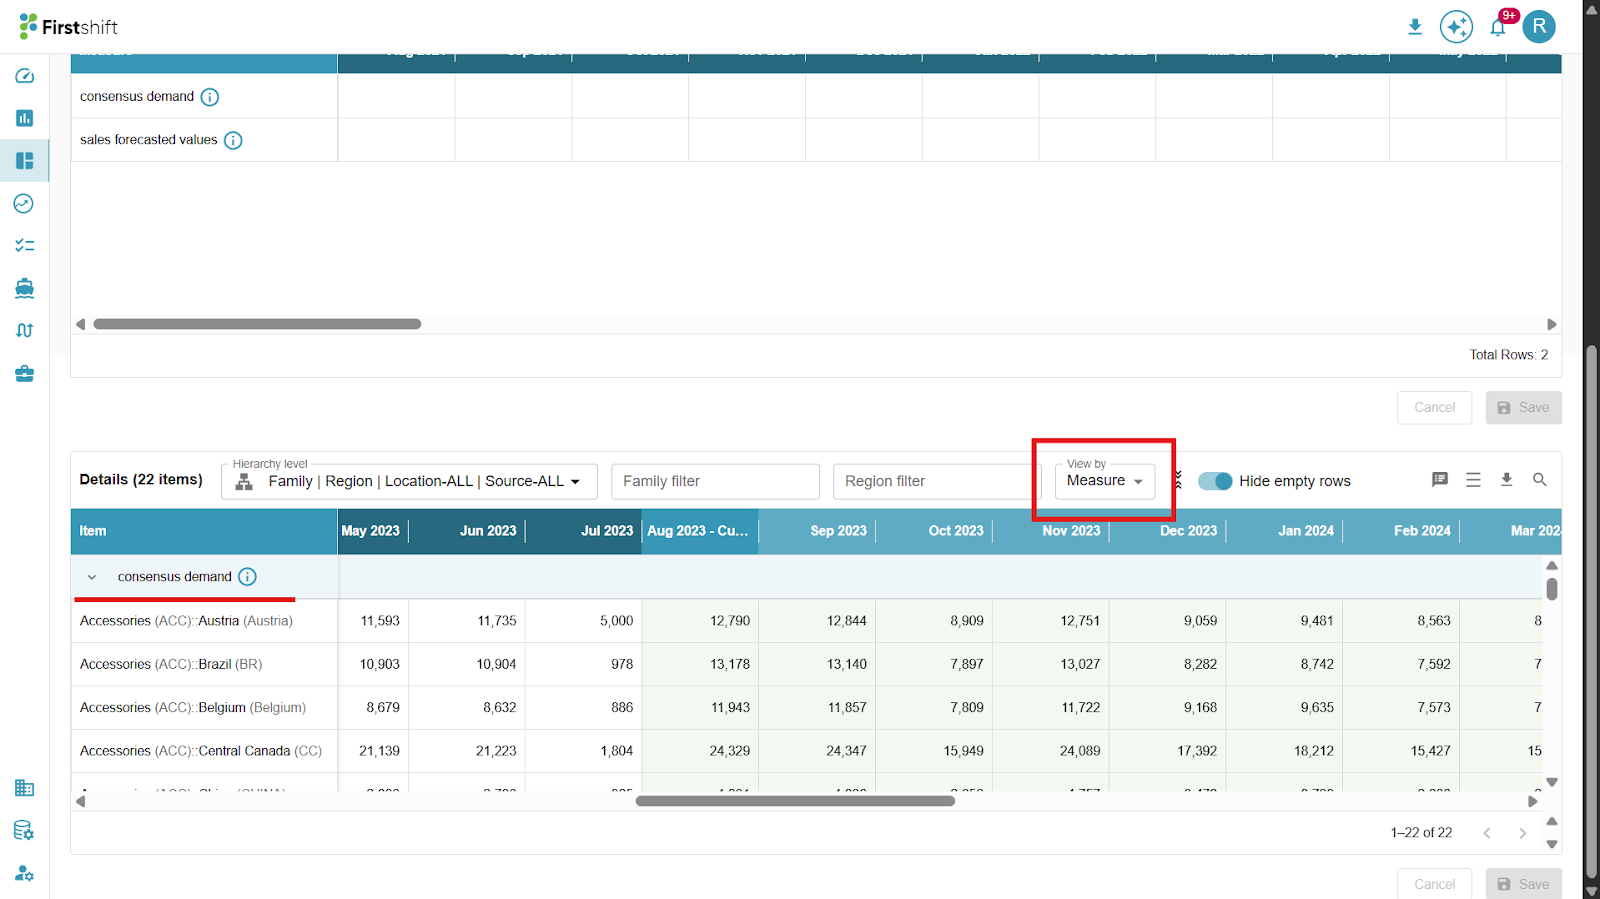
View by measure: The selected measures appear as headers in the Measure View, with item values displayed below. This view enables us to analyze results based on the selected measures. The application displays the measure based on the column order.
Example: If the selected measures are Shipped units, Demand units, or Inventory units, all selected measures appear as a header, and the disaggregation level appears below the measures.
View by Dimension: The Dimension View organizes data by items and measures, enabling comparative analysis across dimensions.
Example: If the selected drilldown hierarchy includes Product and Customer, and the measure is Sales Quantity, the Dimension View will display:
Product | Customer | Measure.
Studio JPS 14 v1 | Max stores | Shipped units.This view provides a comprehensive breakdown of data across dimensions, helping in more granular analysis.

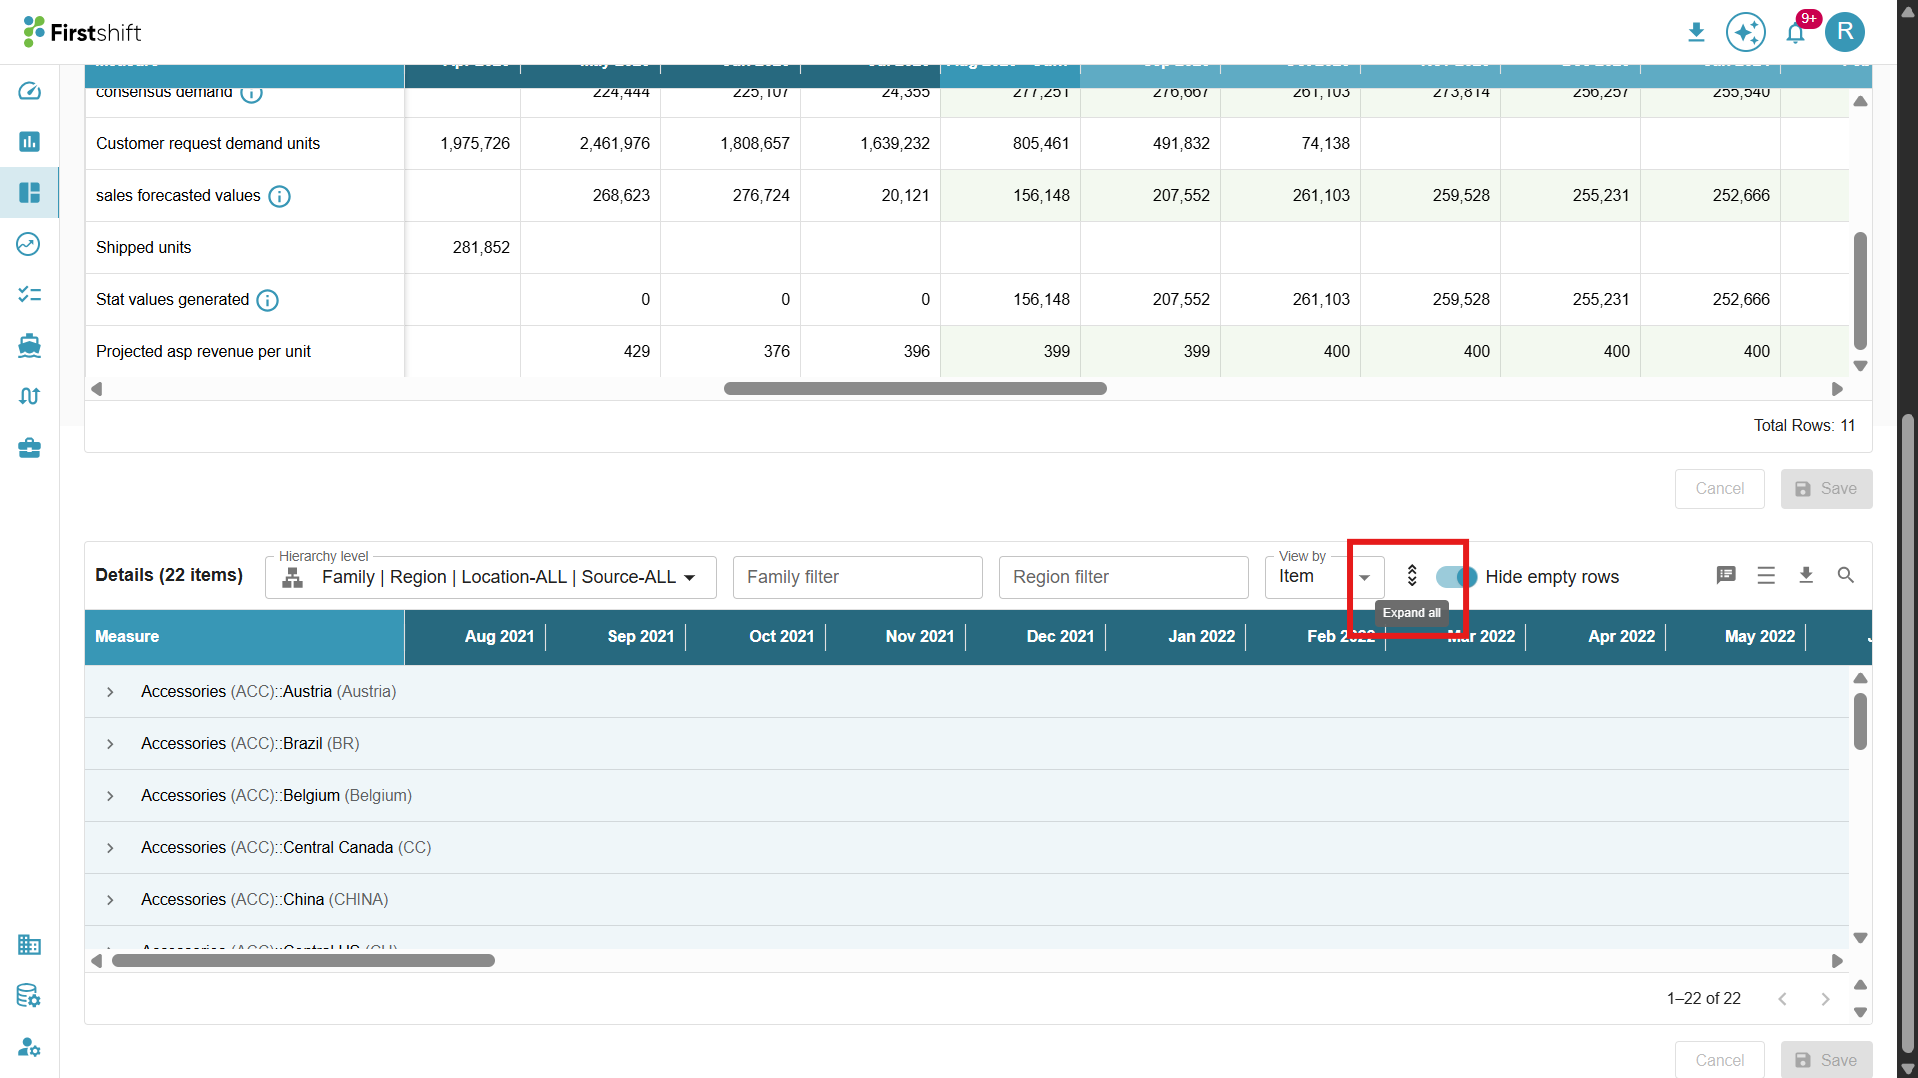
Expand all, collapse all
Expand All:
By default, the drilldown table is collapsed, showing only the header data.
To view the details of the drilldown table, click Expand All.
This will expand the table to display results based on the selected hierarchy level.
The expanded view of the table is shown below.
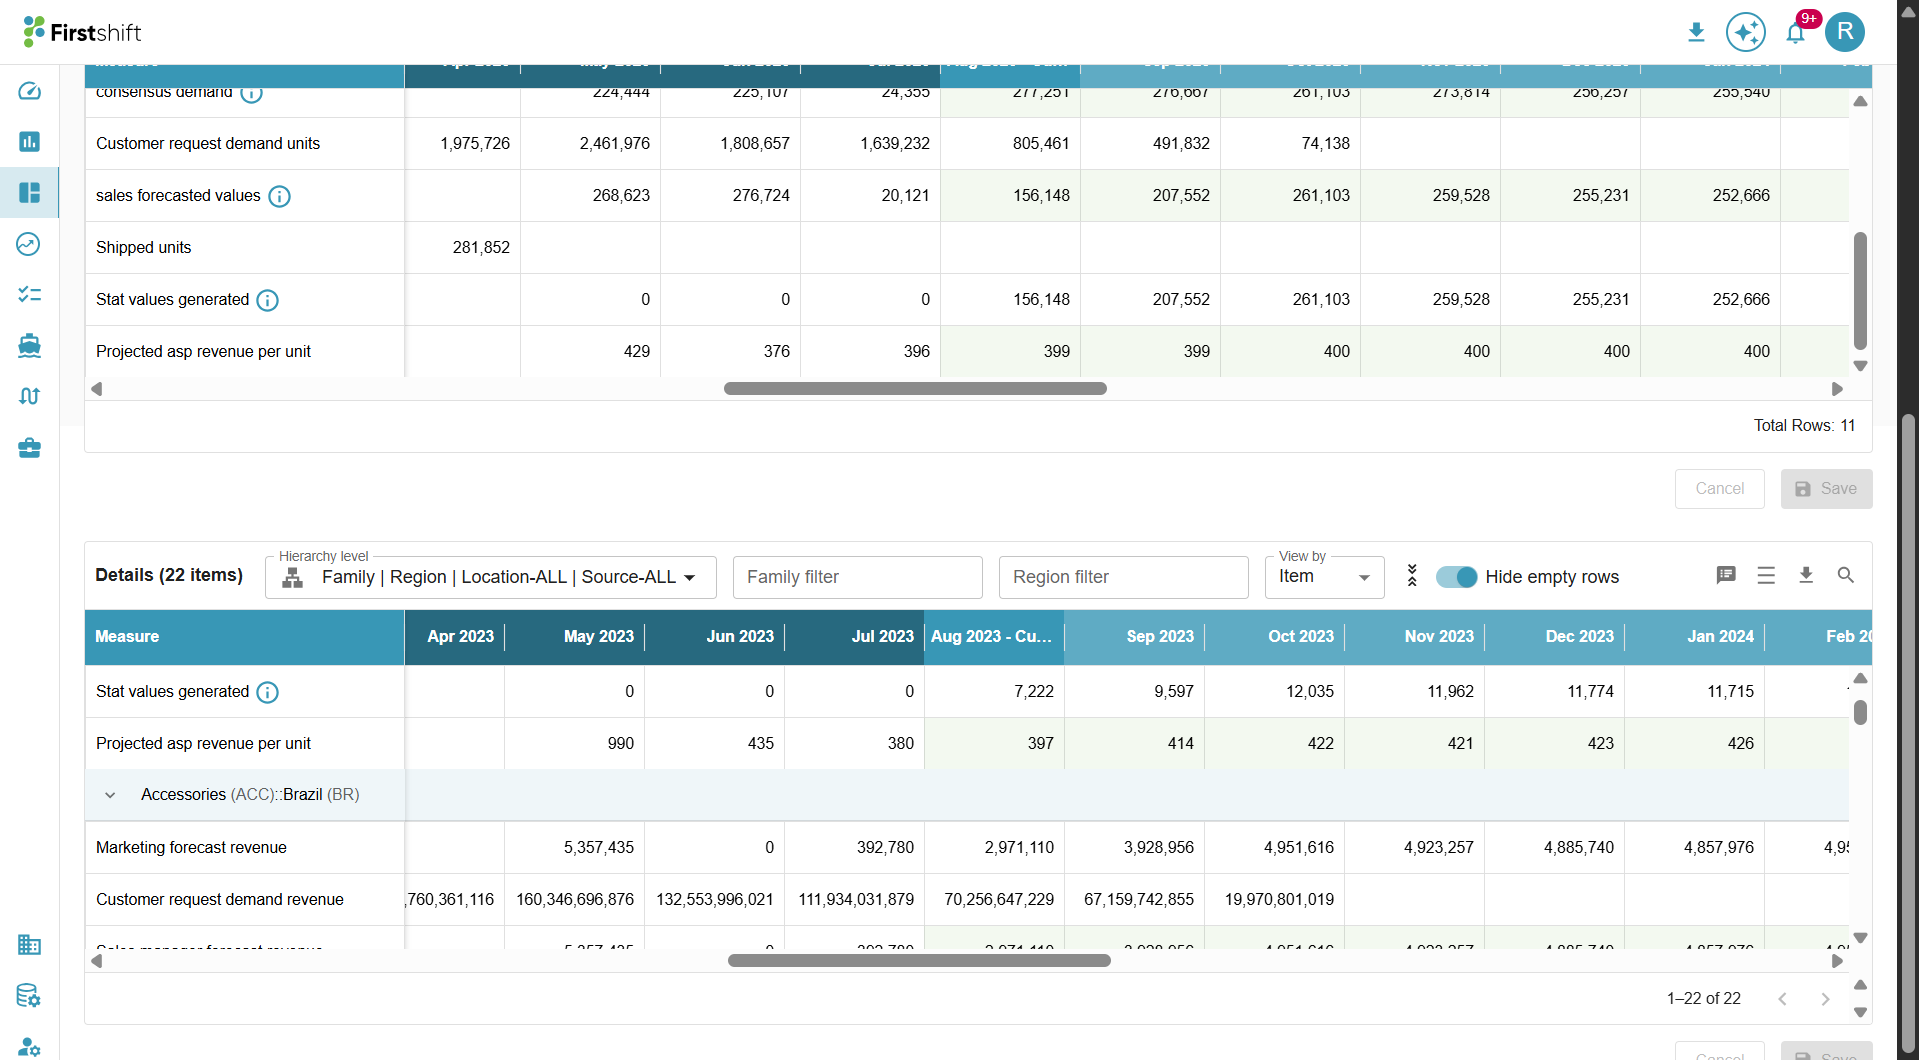
You can also expand a single row by clicking on the arrow button provided next to each header. This allows you to view the detailed breakdown of that specific hierarchy level without expanding the entire table.
Collapse All
After clicking Expand All, the Collapse All button will be enabled.
Click on Collapse All to revert the table to its original format, hiding the expanded hierarchy levels.
This helps maintain a cleaner and more structured view by displaying only the top-level data.
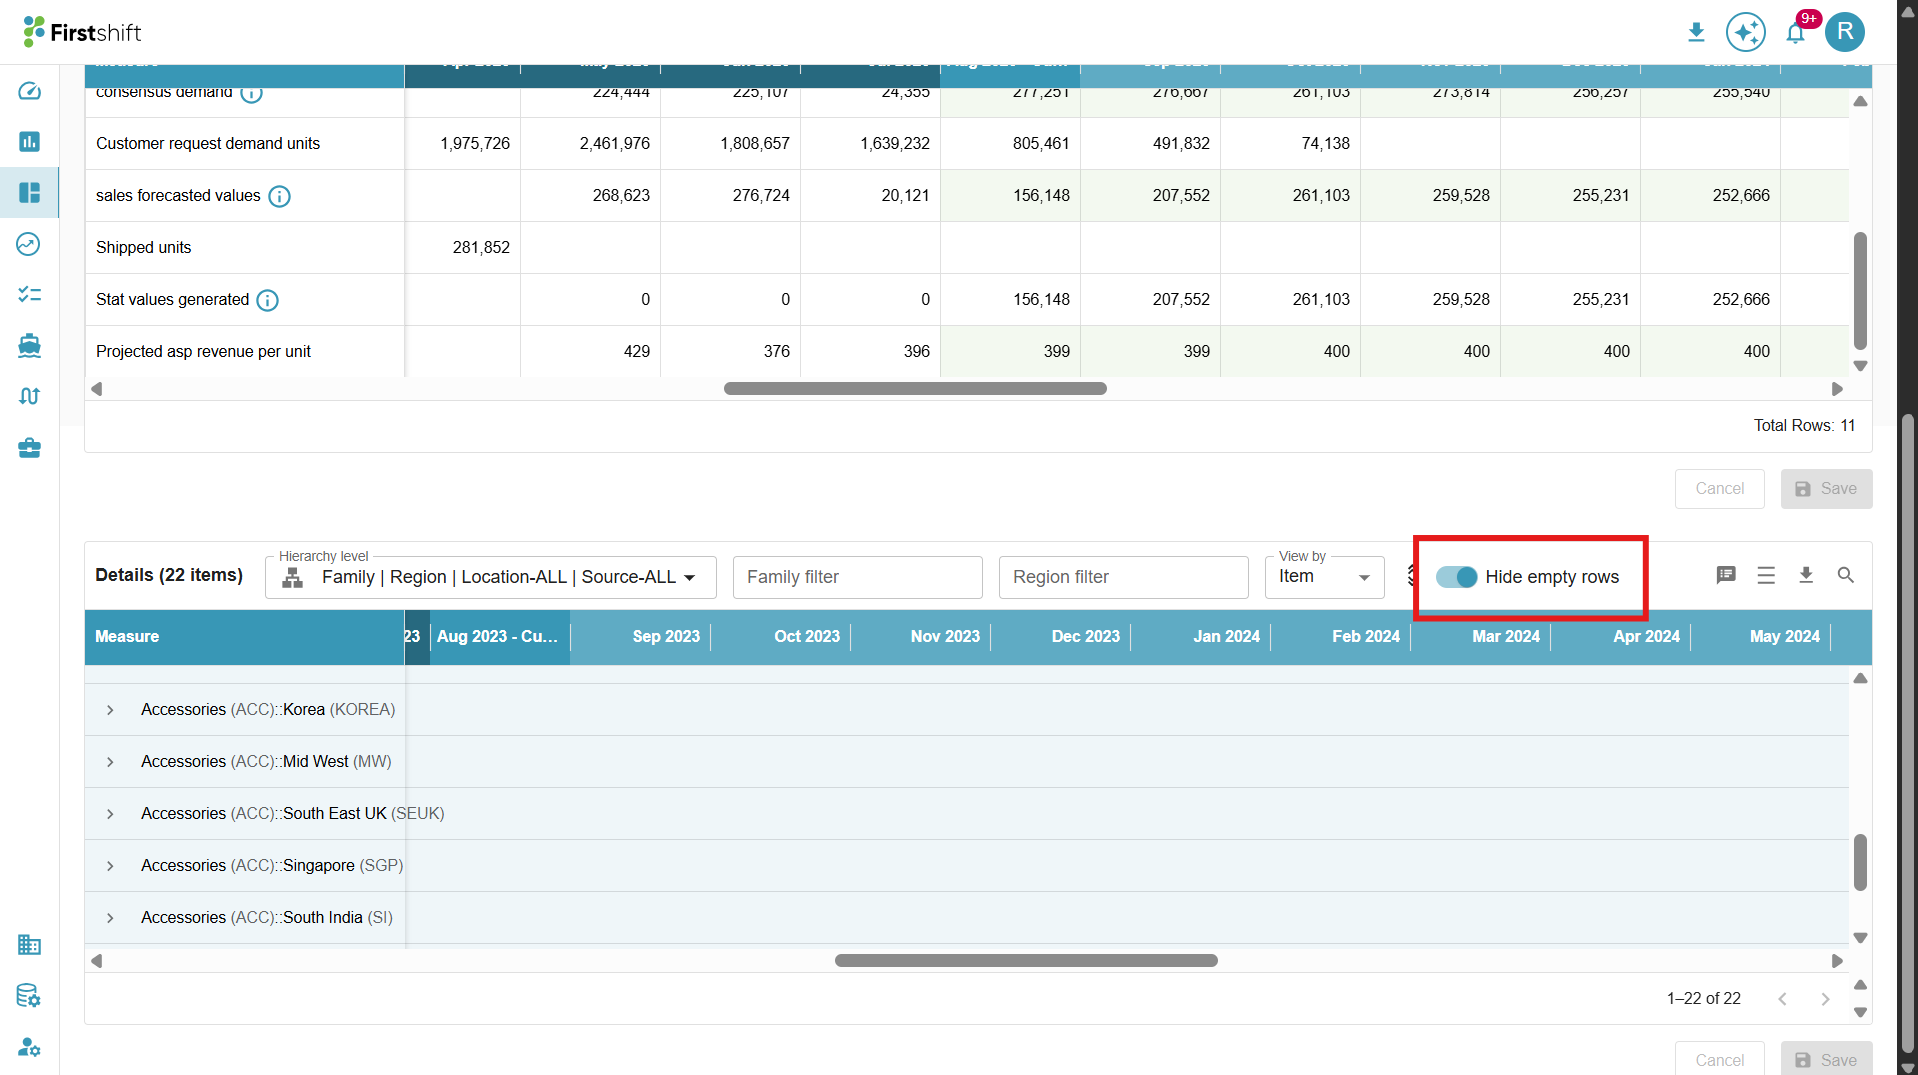
Hide Empty Rows
Enable: If you want to remove rows where all measure values are zero, enable the Hide Empty Rows toggle. This will remove measures with zero values, keeping the table concise and focused on relevant data.
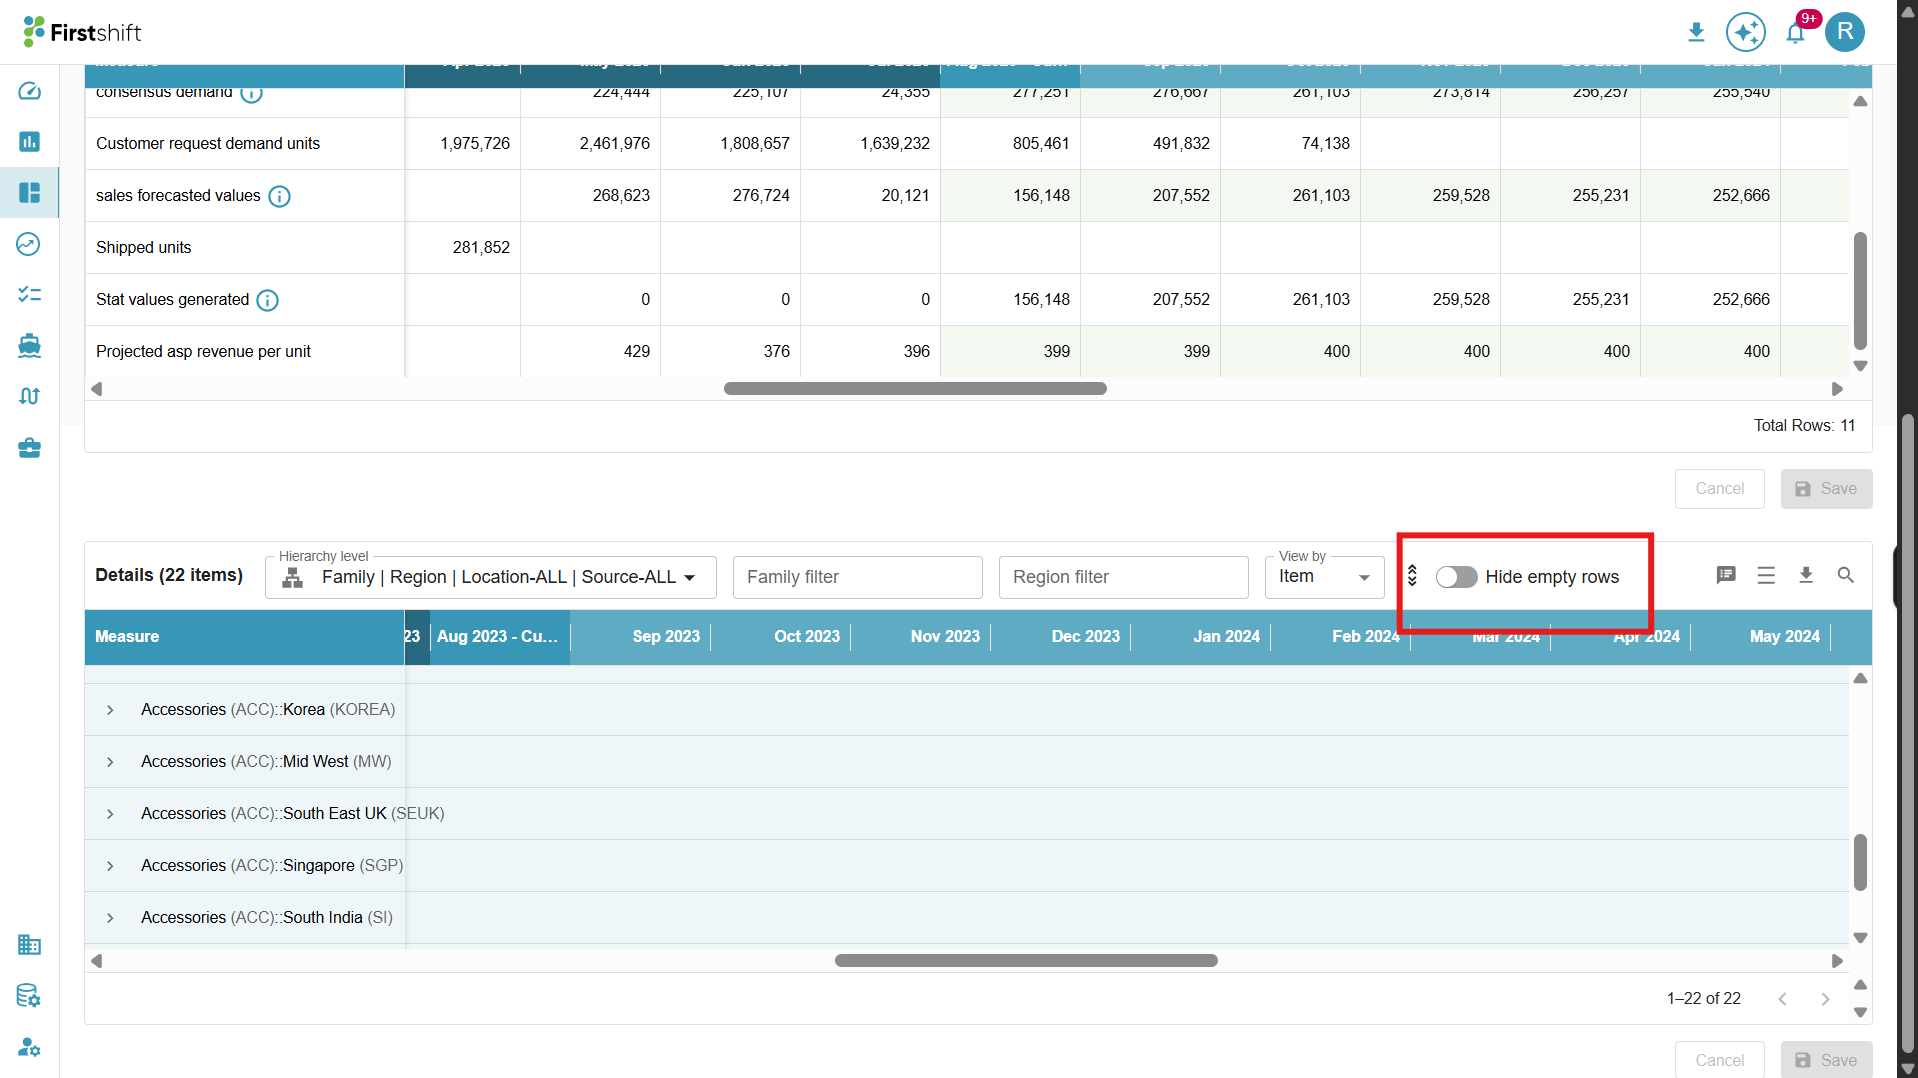
Disable: If the measures of the selected items have zero values across the entire time range, they will be hidden when the “Hide empty rows” toggle is enabled. Disabling the toggle displays all measures in the table, including those with zero values.
Download
The values in the bookmark can be downloaded in the single-item view. The downloaded files will show the values based on the selected preferences.
Example: If you select only shipped units from the measures pop-up and a custom time range from Jan 23 to Apr 23, the downloaded file will show the measures and data for those units shipped during that period. Similarly, the downloaded sheet will show results based on the user preferences, such as expand all or collapse all, selected hierarchy level, selected view by, etc.

The Download option provides two choices:
Desktop Download (Max 50 items): This option allows you to download data for up to 50 items displayed in the planning view.
Download Full Dataset: This option lets you download the data directly from the server side, ensuring that all relevant filters and view types (such as item, measure, and dimension) are included in the output. This enables a comprehensive download of the entire dataset with the applied configurations.
When this option is selected, the download process initiates a server-side download of all relevant data from the database, rather than from the UI or a direct SQL query.
This download supports all filters applied in the planning view, including Dimension Filters (e.g., Product, Customer, Location, Source), Measure Filters, and Time Range Filters.
The full dataset download details will be stored in the download folder within the user interface.
Click on the Refresh button to update and view the latest status of the dataset download.
Status:
Active: The download was successful and is ready for use.
Processing: The download is still in progress and has not yet been completed.
Failed: The download was unsuccessful due to an error.
Multi-item view
The Multi-Item View in the Planner Workbench allows you to analyze multiple planning items simultaneously in an aggregated format. This view provides a consolidated perspective on the selected items, enabling you to evaluate overall trends and performance across them.
Accessing the Multi-Item View:
To switch to the Multi-Item View, click the stack icon in the Planner Workbench. The application then displays the aggregated view of the selected planning items in the multi-item view.
How It Works
The Multi-Item View is similar to the Single-Item View, but instead of displaying data for a single item, it aggregates the values of all selected items and presents them in tabular format.
Summary table: The Summary Table in the Multi-Item View displays aggregated values for the selected items. Since the data is aggregated, cell-level options are not available in this table. Actions such as overrides, editing, or cell-specific operations cannot be performed.
Details table: The table shows the planning items available for the selected hierarchy level. All the cell options are available for the values in the multi-item view details table.
Hierarchy dropdowns
In the Multi-Item View, hierarchy dropdowns are displayed based on the hierarchy levels selected during bookmark creation. These dropdowns let you refine the planning view by selecting specific items in the hierarchy.
When a bookmark is created with certain hierarchy levels, the Multi-Item View automatically displays dropdowns for those levels. You can use these dropdowns to filter the aggregated data and focus on specific item values.
Example
If the bookmark is created with the hierarchy Family: Region: All: All, the Multi-Item View displays dropdowns for:
Family
Region
If the bookmark is created with the hierarchy Family: All: All: All, the Multi-Item View displays only the Family dropdown.
Was this article helpful?
That’s Great!
Thank you for your feedback
Sorry! We couldn't be helpful
Thank you for your feedback
Feedback sent
We appreciate your effort and will try to fix the article